We can learn a lot about the behaviour of the Sun/ Earth system via an examination of historical temperature data. This little essay illustrates that point.
All data is presented as a 12 month moving average centered on the seventh month. Data sourced from: Kalnay, E. and Coauthors, 1996: The NCEP/NCAR Reanalysis 40-year Project. Bull. Amer. Meteor. Soc., 77, 437-471. at:
http://www.cdc.noaa.gov/cgi-bin/data/timeseries/timeseries1.pl
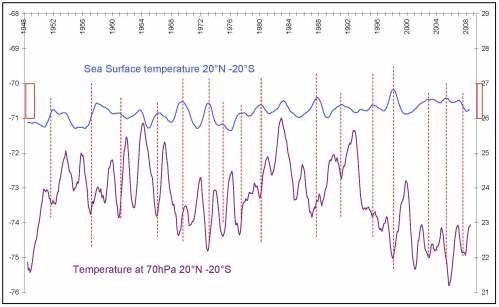
Figure 1 Response of lower stratosphere to ocean warming
When the tropical sea heats up evaporation is enhanced. Convection tends to carry moisture high up into the tropical atmosphere and some overshoots the tropopause into the stratosphere where it encounters ozone.
Ozone is soluble in water. In the commercial manufacture of ozone the air that is to carry the ozone is cooled to minus 80°C so as to dry it out and make it possible for that air to convey the ozone to the point of application, for example the empty wine barrel to be sanitized.
Ozone is a strong absorber of both UVB from the sun (or we would get more sunburn and more cancer) and also long wave radiation from the earth. The ozone molecule swiftly transfers the extra energy gained to the surrounding air and the temperature of that air increases. If however the ozone content of the air diminishes there is less heat imparted to the air and its temperature falls. So air that contains ozone can fall in temperature from two sources. The first is a reduction in radiation. The second is a reduction in ozone content.
Figure 1 demonstrates that increased evaporation in the tropics is accompanied by a fall in the temperature of the air in the lower stratosphere at 70hPa. This fall in the temperature of the air at 70hPa relates directly to the magnitude of the increase in sea surface temperature. The fall in temperature in the stratosphere at 70hPa is due to loss of ozone into water solution.
How far into the stratosphere does this effect extend?

Figure 2 Response of stratosphere to humidification and solar activity
Figure 2 shows that the fall/rise in the temperature of the air at 70hPa also occurs at 50hPa and 30hPa. This shows that the stratosphere is fairly well mixed, and relatively speedily so, despite the more sluggish convection (than in the troposphere) due to the temperature increase with elevation.
If the temperature of the air in the stratosphere falls as the surface warms (due to the evaporation humidifying the stratosphere) we would expect the temperature of the stratosphere to warm as the surface cools. That indeed is what has happened since 1998. I show the increase in stratospheric temperature with arrows. The increase is due to more ozone in the stratosphere as the tropical ocean has gradually cooled.
Now I want to draw the readers attention to what is going on at 10hPa when the surface warms. After 1978 when the sun became very active and tropical sea surface temperature jumped we can trace the episodic fall in temperature all the way from 70hPa to 10hPa. The paradox is that the micro-structure involves cooling during specific El Nino warming events but the macro-structure shows a general increase in 10hPa temperature due to a secular increase in ozone due to the impact of enhanced ionizing radiation on oxygen. If we examine the data closely we see that prior to 1978 a rise in 70 hPa temperature (due to enhanced ozone as the tropical sea surface episodically cools) is accompanied by a fall in 10hPa temperature due to diminished solar activity (less ionizing short wave radiation). This observation links the sun with surface temperature change.
If the macro-structure at 10hPa shows the impact of ionizing radiation on oxygen we can see from the curve that this particular macro warming event that began in 1978 is not yet over. We have some way to go before 10hPa temperature returns to the 1948 level.
Let’s move right along to an examination of temperature change in the atmosphere since 1948.

Figure 3 Temperature change in the lower troposphere
Figure 3 shows that in general the lower levels in the atmosphere have definitely warmed. Whatever the cause of this warming, and the analysis above suggests that it is entirely due to the sun, the atmosphere above 400 hPa is not storing warmth. Its temperature has not increased at all. Below 700hPa temperatures took off in 1978 and have not yet returned to base level. Above 700 hPa temperatures have returned to base level on many occasions, most recently in the year 2000. Why have temperatures below 700hpa not returned to base? I suggest that it is because these levels are too close to the great earthly store of warmth, the ocean.
In passing we note that the largest increase in temperature is not at the surface but at 850hPa (1 km) where water vapour condenses to form cloud. This is not a ‘greenhouse effect’ but is due to release of latent heat of condensation. The tropics tend to be heat saturated so more energy goes straight into evaporation. Water is the Earth’s refrigerant gas and the troposphere is the engine that drives the refrigeration mechanism.

Figure 4 Temperature change in the upper troposphere
Figure 4 shows the pattern of heating in the upper troposphere. Again we note the lack of any long term increase in temperature. At all levels the temperature has returned to base. However, between 200hPa and 100hpa the period of increased solar activity that is evident in 10hPa temperature in figure 2 manifests as a strong and sustained increase in temperature between the onset in 1978 and demise about 2006.
Those who have followed my discussions with Leif Svalgaard will know that he steadfastly maintains that 200hPa temperature simply reflects surface temperature and that the level of ozone in the troposphere below the tropopause (100hPa) is too slight to produce a thermal response to UVB. He is plainly incorrect. The surface is warmer today than in 1948 but 200hPa temperature is back to 1948 levels. Look again I say?
Above 500hPa the temperature of the air is below freezing point and clouds exist as micro crystalline ice with highly absorptive (infrared) and reflective (visible spectrum) properties. In the period of warming between 1978 and 1999 the ratio of ice cloud to droplet cloud changed because, while humidity fell continuously at all levels evaporation in the tropics and convection kept up the moisture supply to the upper troposphere and, as we have seen, the stratosphere. In this regime ice cloud becomes an ever more important constituent of the Earths armoury against solar radiation. When the temperature of the upper troposphere warms ice cloud evaporates and more sunlight gets to the ocean surface. This is the atmospheric dynamic that drives ENSO.
Take home messages:
- There is a natural cycle that drives the concentration of ozone in the stratosphere. This is shown by the cooling at 70hPa as the tropical sea warms.
- The influence of the sun is seen in the micro-structure and the macro-structure of temperature at all levels of the atmosphere above the 200hPa pressure level between 20°N and 20°S.
- The atmosphere does not store warmth. Above 700hPa it has returned to base temperature after each warming episode between 1948 and 2008. It is the sea that stores warmth.
- The rate of warming at 850hPa (1 km) is a good measure of the increased energy that the Earth receives from the sun over the course of time. It is here that the temperature has increased most since 1978. Temperature at 850hPa will only return to base when the tropical oceans themselves return to base temperature. This return seems to be in process but rest assured that warming and cooling events will continue to provide a secure topic for everyday conversation.
- Cooling of the stratosphere is not due to greenhouse gas warming of the troposphere. There is no temperature change in the lower troposphere except very close to the warmer ocean. Cooling of the stratosphere is due to ozone loss associated with surface warming.
- Ozone loss in the stratosphere is a natural consequence of sea surface warming.
Have you comprehended the argument? Here is a test.
Explain why 10hPa and 100hPa temperatures are in sync under high solar activity and out of sync at low solar activity as seen in figure 5 below.

Figure 5 Temperature change at 10hPa and 100hPa

Thanks for the heads up Erl.
By: Mike Davis on February 5, 2009
at 12:36 pm
Just finished reading. Thanks again. Makes sense but then I believe in natural climmate cycles.
By: Mike Davis on February 5, 2009
at 12:57 pm