Posted by: erl happ | January 1, 2016

Announcement

My name is Erl Happ. The ‘Erl’ is an abbreviation of Erland.

In the second last paragraph in the last post on this blog ‘climate change 1’, written in August 2013,  I  wrote:

A new narrative is required that accounts for the seasonal and hemispheric differences in the advance and retreat of surface temperature that we observe. That narrative will describe the annual modes (should be annular) linking them to the state of surface pressure relations that drive the winds, cloud cover, surface temperature and rainfall. Change in the annual modes will be linked to variation in the ozone content of the stratosphere. Variation in the ozone content of the stratosphere will in turn be linked to the influence of the sun in ionising the atmosphere and the solar wind affecting the electromagnetic environment of the ionised atmosphere. The atmosphere will be seen to move to and from the poles and to pile up in equatorial latitudes when it departs the poles, chiefly Antarctica. This initiates change in the annular modes. Once initiated, forces within the Earth system tend to enhance and exaggerate change in the atmosphere, promoting and lending persistence to new states.

The good news is that I returned this endeavour a year ago, and made some very exciting breakthroughs, almost by accident. I am now able to provide a coherent account of the workings of the atmosphere, the drivers of change in surface weather and the source of natural climate variation, an endeavour that I have always considered to be vital in order to ascertain whether man is at all, partly or wholly responsible for the increase in surface temperature over the last 70 or so years. The first four posts in a series of about thirty chapters, prepared over the last three months of 2015, appear at the new WordPress site:

https://reality348.wordpress.com/

The very good news is that it appears that natural organic processes can account for all the change that has been observed over the period where good data is available.

The not so good news is that a globe that is on balance uncomfortably cool, is about to get cooler. The process of change to a cooler Earth has been under way now for two decades. It is signalled in the evolution of temperature in those months that respond most strongly to polar atmospheric  processes.

It is indeed a pleasure to present this work.


Posted by: erl happ | August 11, 2013

The Turning Point

Ozone profile

Sample ozone profile Valentia observatory 52° Nth Latitude, Ireland. The light blue line is called the tropopause where there is sufficient ozone to cause the atmosphere to warm with increasing elevation. The troposphere below the blue line is that part of the atmosphere where temperature falls with increasing elevation. It is the weather sphere where moisture and cloud are present.

Shows the increase in ozone concentration in winter

Shows the increase in ozone concentration in winter

Troposphere and stratosphere-page-001

This diagram of the boundary of the troposphere and the stratosphere, called the ‘tropopause’ has the virtue of showing the average annual distribution of ozone by latitude but it should be borne in mind that ozone content peaks very strongly in the winter hemisphere. The diagram shows nothing of the effects of the interaction of the mesosphere with the troposphere in reducing or enhancing ozone content above the poles.

If you thought that ozone was confined to the stratosphere observe the concentration of ozone over Valentia Ireland (52° North Lat.) between 400hPa and 200hPa, an altitude that is well within the troposphere.  Because ozone absorbs long wave radiation from the Earth (just like CO2 but more efficiently), it heats the surrounding atmosphere, dries it and evaporates cloud cover. A change in the ozone level of the upper troposphere changes surface temperature because more solar radiation reaches the surface when there is less cloud. Ozone is carried from the stratosphere into the troposphere over the oceans on the margins of the Antarctic and the Arctic and also in the high pressure cells of the mid latitudes. These cells intensify in winter. Change the ozone concentration of the upper troposphere and you change surface climate. The ozone concentration of the northern hemisphere troposphere has doubled over the last 50 years.

Background

Man’s knowledge of the atmosphere and the manner in which it changes over time is still in its infancy. In the 1890s balloonists were very surprised to discover that at about 10km in elevation in the mid latitudes the atmosphere began to warm with increasing elevation. It was not until 1951 that Richard Scherhag first observed a sudden stratospheric warming. In 2013 opinion is still divided as to the cause of these phenomena.

The British meteorologist G. M. B. Dobson, developed a simple spectrophotometer (the Dobsonmeter) that could be used to measure the presence of ozone in the atmospheric column from the ground. Between 1928 and 1958 Dobson established a worldwide network of ozone monitoring stations.

The advent of satellites has enabled exploration of the upper more rarefied atmosphere. Vast resources in manpower and cash have been devoted to this work. Arguably we might have learnt more about the atmosphere and how surface temperature is determined if we devoted more effort to the study of the atmosphere where it is densest, that part of the atmosphere that gives rise to  clouds that reflect sunlight. More than 75% of the atmosphere lies within the troposphere.

The presence of ozone, a strong absorber of long wave radiation from the Earth, accounts for the warming of the atmosphere at elevations above about 10 km (in the mid latitudes). But ozone is not confined to the stratosphere. The role of ozone in modulating air temperature and cloud cover in the middle and upper troposphere is undocumented in mainstream climate science.

Ozone in the troposphere is influential because of its effect on the temperature of the air, its local density and therefore the near surface circulation. Nowhere is this demonstrated as dramatically as in an annular ring of extremely low pressure air that surrounds Antarctica. Surface pressure relationships are vital in determining wind strength and direction, the distribution of heat at the surface by location and by season and the distribution of rainfall.

The pressure of the atmospheric at sea level indicates the weight of the molecules in the atmospheric column. If the atmospheric column gains in ozone content its density falls as its temperature rises. Molecules are displaced laterally into locations where the temperature has not changed . This changes the distribution of surface pressure, especially at high and mid latitudes. It is not generally appreciated that dramatic changes in ozone content occur in the polar regions over time that are influential in determining weather and climate at the surface.

Unlike the temperature record, surface pressure is unaffected by the activities of man. We can have much more confidence in the surface pressure record than the temperature record. Unfortunately however, there are parts of the globe where observations of surface pressure are recent and sparse. This is especially the case in the southern hemisphere in mid to high latitudes. It is fortunate that many research stations were established in Antarctica from the 1950’s onward because the atmosphere above Antarctica is vital for the evolution of surface climate in both hemispheres.

Observation

The data that presented here has been produced by reanalysis work documented by: Kalnay, E. and Coauthors, 1996: The NCEP/NCAR Reanalysis 40-year Project. Bull. Amer. Meteor. Soc., 77, 437-471. This data is accessible both in terms of monthly averages and graphically at; http://www.esrl.noaa.gov/psd/cgi-in/data/timeseries/timeseries1.pl

Fig 1

10hPa temperature 60-90° south

10hPa temperature 60-90° south

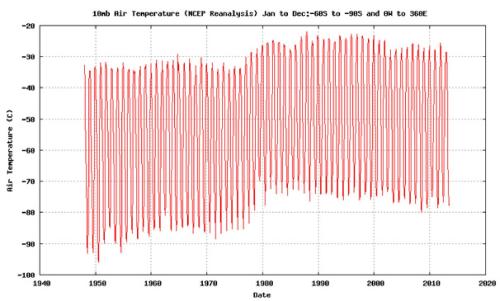
Figure 1 shows the monthly flux of temperature at 10hPa over Antarctica. We see that, between 60° and 90° of latitude in the late 1970’s there occurred a sudden increase in the temperature of the ozone bearing stratosphere at 10hPa (26km). Temperature increased by about 10°C both in summer and winter. This was a stepwise increase that was most dramatic in winter when the night jet bringing nitrogen oxides from the mesosphere into the stratosphere is most active. This temperature change is undoubtedly due to an increase in the ozone content of the upper stratosphere. That in turn is most likely due to a reduction in the flow of mesospheric nitrogen associated with a shift in the atmosphere that weakened the night jet. Since the stepwise change in the late 1970’s temperatures at 10hPa have tended to fall away.

Fig 2

Fig 2-page-001

30hPa temperature 60-90°south

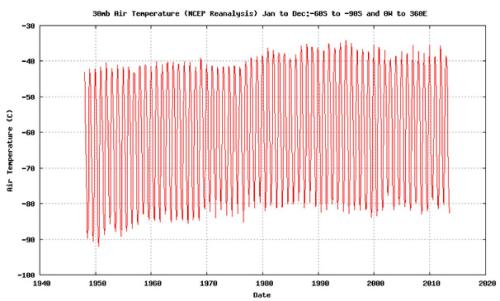
A temperature increase in the Antarctic atmosphere at 30hPa (22km), in the late 1970’s, is apparent in figure 2, though much less obvious than at 10hPa. The stepwise change is more apparent in the maximum than the minimum. It is apparent from figures 1 and 2 that it is the upper margins of the stratosphere where interaction with the mesosphere is most active, that exhibits the more obvious stepwise change in temperature.

Fig 3

850hPa temperature 50-60°south

925hPa temperature 50-60°south

At 50-60° south where a ring of low pressure surrounds Antarctica, a relatively sudden warming is seen at 925hPa (close to the surface), in the late 1970’s. This is consistent with an increase in ozone in the air column in these latitudes.

Figure 4

Fig 4-page-001

Sea Level atmospheric pressure 50-60° south

The gradual loss of atmospheric pressure at 50-60° south consequent upon the increase in the ozone content of the air (and increase in temperature) is very evident in figure 4. A survey of atmospheric pressure by latitude shows that the atmosphere between 50° and 90° south was progressively depleted. The severe collapse that occurred in the late 1970s is very noticeable. This collapse followed a short reprieve just after the middle of the decade.

The fall in atmospheric pressure that took place after 1950, south of 50° south latitude, is associated with increasing atmospheric pressure elsewhere. The increase in pressure is nowhere greater than at latitude 30-40° south. As pressure falls at 50-60° south it rises at 30-40° south and the differential between the two increases. This differential determines the strength of the prevailing wind, the north westerlies.

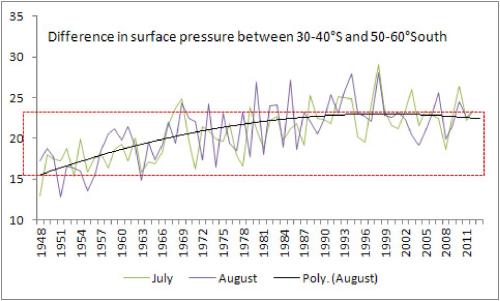
Figure 5 shows the increasing, then stabilising, and post 1998 declining difference in atmospheric pressure, between 30-40°south and 50-60° south latitudes. This data is derived quite simply by subtracting the average monthly surface pressure at 50-60°south from the pressure at 30-40° south. The winds between these latitudes are the strongest on the planet. These winds are described by sailors as the ‘Roaring Forties’, the Furious Fifties and the ‘Screaming Sixties’. As noted above, the Roaring Forties are winds of north westerly origin blowing towards the margins of Antarctica. Over the fifty years to 1998 wind strength gradually and relentlessly increased.

This is a phenomenon that is of little interest to mainstream climate science. This is not the first time that these winds have experienced a change in vigour. A similar change is documented in the logs of sailing ships that frequented these latitudes in the eighteen hundreds.

Figure 5

SLP at 30-40°south latitude less SLP 50-60°south latitude

SLP at 30-40°south latitude less SLP 50-60°south latitude in July and August

The pressure differential driving the Roaring Forties et al  in winter increased from about 15 mb in1948 to about 23mb in 1997-8. However, the polynomial curve suggests that after peaking in the late 1990’s the differential is now decreasing.

Figure 6

SLP 30-40°south less SLP 50-60°south in January and February

SLP 30-40°south less SLP 50-60°south in January and February

The pressure differential in summer increased from 15 mb to 20mb. Again, the polynomial curve suggests that the differential is now decreasing.

Causation

  • The pressure differential driving the north westerlies is a function of the strength of the Southern Annular Mode. This mode relates to the annular ring of extremely low surface pressure on the margins of Antarctica and its relationship to the annular ring of high pressure at 30-40° south. There is no plausible explanation in climate science for the existence of this annular ring of low pressure on the margins of Antarctica and no apparent interest in accounting for its existence, let alone the change that occurs over time.
  • While there is no agreement in academic circles as to the reason behind variations in the SAM, it is plain that atmospheric pressure in the polar atmosphere is a function of air temperature in the Antarctic vis a vis the rest of the globe. That is in turn heavily dependent upon the ozone content of the polar atmosphere, especially in winter when enhanced ozone is excited by long wave radiation from the Earth, long wave energy from the Earth being the only source of energy available at that time.
  • The increase in the temperature of the atmosphere in Antarctic regions is at odds with the ideology that suggests that there is a recently developed ‘hole’ in the Antarctic ozone-sphere due to the activities of man. In fact one must recognise the generalised deficiency in ozone in the southern hemisphere by comparison with the northern hemisphere, in all seasons, a phenomenon that is inconsistent with the notion of an atmosphere that is ‘well mixed’ and subject to depletion of ozone only when atmospheric conditions favour depletion by chlorofluorocarbons of anthropogenic origin in spring. This breast beating narrative would be spoiled if the realities  of observed status and change were to be recognised.
  • The primary force determining the ozone content in the polar stratosphere is the degree to which nitrogen oxides, that are hungry for oxygen, descend from the mesosphere. This phenomenon is primarily a function of the interaction between the stratosphere and the mesosphere and it responds to changes in surface pressure.
  • Secondarily, ozone is wasted into the troposphere where it dissolves in water.
  • These two forces depleting ozone from above and wasting it into the troposphere below are much more important than the springtime depletion that aligns with the natural loss of ozone due to impinging sunlight at the end of the winter.
  • The paucity of ozone in the southern hemisphere by comparison with the northern hemisphere is a reflection of the nature of the much stronger atmospheric circulation over Antarctica.
  • The interaction between the mesosphere and the stratosphere and the stratosphere and the troposphere is strongest in winter when the polar atmosphere receives no sunlight and ozone tends to accumulate. In summer the large ozone molecule is easily broken down by short wave energy from the sun. But in winter the polar atmosphere is shaded. So, in winter the breakdown of ozone is of chemical origin. This breakdown is readily apparent in the high altitude night jet directly over the pole. A collapse in the night jet is associated with a plunge in polar surface pressure. These changes are conjunctional. A loss of pressure results in an increase in ozone and marked warming of the stratosphere. That in turn reinforces the loss in pressure.
  • Swings in the ratio of high to mid latitude atmospheric pressure in the northern hemisphere are described as the ‘Arctic Oscillation’. The AO manifests in the Atlantic Ocean as the North Atlantic Oscillation (NAO) and in the Pacific as a strengthening and weakening of the Aleutian Low in relation to atmospheric pressure in the mid latitudes. When surface air pressure is high in relation to mid latitudes cold air streams southwards. This produces freezing conditions to the continental land masses of the northern hemisphere. Conversely when polar pressure is low in relation to the mid latitudes warm westerlies stream north and winter temperatures are more benign. The habitability of northern latitudes in the northern hemisphere is associated with relatively low atmospheric pressure in the Arctic. This is a dynamic that has been observed for centuries.
  •  Variations in the Arctic Oscillation Index have been statistically related to solar activity that is measured in terms of ‘geomagnetic activity’ indices.

Implications for surface climate of change in the Annular modes.

  • The high pressure cell that lies in the Indian Ocean off the coast of Western Australia strengthens in winter. The relative strength of this cell affects the passage of fronts that bring rain to the southern part of Australian continent. The fronts represent the conjunction cold dry air of Antarctic origin and moist air of tropical origin. The formation of a strong high pressure cell off the coast of Western Australia in winter can be observed in the rainfall distribution shown in this animation: http://earthobservatory.nasa.gov/GlobalMaps/view.php?d1=TRMM_3B43M
  • Increasing air pressure at 50-60°south is associated with a weakening of the winter high pressure cell in the Indian Ocean. Increased winter rainfall in the SW of Western Australia will be experienced as the annular mode in the southern hemisphere reverses the trend of the last sixty years.
  • The decline in Western Australian rainfall in the populated south west has coincided with a period of increasing temperature in the northern hemisphere, primarily in winter. This is associated with a dominance of El Nino phenomena in the tropical oceans. El Nino dominance is in turn related to diminished cloud cover associated with the enhanced ozone in the counter westerly circulation that carries ozone towards the equator warming the air and reducing high altitude cloud cover, This phenomena is comprehensively described in the last post on this blog.
  • The warming of the northern hemisphere in winter that occurred between 1976 and 1998 associated with a positive AO index is now reversing as the AO index moves into the negative mode (increased polar pressure). This confounds the predictions of those who forecast that the AO would continue to strengthen in association with an increase in the CO2 content of the atmosphere.
  • With the turning point in southern hemisphere pressure relations that occurred in the late 1990s the globe is experiencing a stable temperature regime. There has been no warming since 1998. As the SAM moves into a negative mode (increasing Antarctic air pressure and a cooling stratosphere) surface cooling should be expected, especially in winter. Neutral to La Nina conditions should prevail in the tropics, continuing a trend that became well established after the turn of the century.

Politics, ideology, resource use, and waste

The narrative that associates increased CO2 in the atmosphere to surface warming and ‘climate change’ is confounded by the cessation of surface warming after the El Nino event of 1998. Those who promoted that idea should now admit that their notion is false. Predictions based upon that notion were and have always been ill founded. This is not the first time that society has been the victim of an evangelistic movement with an appealing political agenda.

A new narrative is required that accounts for the seasonal and hemispheric differences in the advance and retreat of surface temperature that we observe. That narrative will describe the annual modes linking them to the state of surface pressure relations that drive the winds, cloud cover, surface temperature and rainfall. Change in the annual modes will be linked to variation in the ozone content of the stratosphere. Variation in the ozone content of the stratosphere will in turn be linked to the influence of the sun in ionising the atmosphere and the solar wind affecting the electromagnetic environment of the ionised atmosphere. The atmosphere will be seen to move to and from the poles and to pile up in equatorial latitudes when it departs the poles, chiefly Antarctica. This initiates change in the annular modes. Once initiated, forces within the Earth system tend to enhance and exaggerate change in the atmosphere, promoting and lending persistence to new states.

Scarce resources are currently being wasted on a ruinous scale in pursuit of an objective that is based on a false understanding of the atmosphere. The drivers of surface climate relate to ozone not carbon dioxide. The political agenda derived from the CO2 narrative is unbelievably wasteful. Much is to be gained if, and only if, those who have pushed the global warming bandwagon come to their senses and admit their error. Politicians cannot do this for them. It was the ‘science’ that was in error. Too many who claim to be ‘scientists’ have misled us. Now is the time to put matters right.


Posted by: erl happ | December 17, 2011

Climate changes – oh so naturally.

atmospheric circulation diagram, showing the H...

Image via Wikipedia

Atmosphere diagram showing stratosphere. The l...

Image via Wikipedia

Outline

Change in the planetary winds (conceptually documented in the diagram above) is the least remarked but most influential dynamic affecting surface temperature.  Wind is a response to pressure differentials. So, a change in the wind is due to a change in these pressure differentials.

The following post describes why pressure differentials and the the planetary winds change over time.

From Wikipedia we have: “the troposphere is the lowest portion of Earth’s atmosphere. It contains approximately 80% of the atmosphere’s mass and 99% of its water vapor and aerosols. The average depth of the troposphere is approximately 17 km (11 mi) in the middle latitudes. It is deeper in the tropical regions, up to 20 km (12 mi), and shallower near the poles, at 7 km (4.3 mi) in summer, and indistinct in winter.”

The notion that there is  a tropopause in high latitudes or that it is somehow ‘indistinct in winter’ represents sloppy thinking.  At high latitudes, in winter, the air is not heated by the surface (very cold) or the release of latent heat (a cold desert). Neither is it heated directly by the sun (below the horizon). It is heated by the absorption of long wave radiation from the Earth by ozone. In consequence parts of the polar stratosphere and the troposphere are permanently locked together in convection. Consequently ozone descends into the near surface atmosphere.  This process changes the distribution of atmospheric mass and therefore surface pressure. It governs the strength of the planetary winds and cloud cover in the troposphere.  The process manifests as the Northern Annular Mode (or the Arctic Oscillation) and the Southern Annular Mode. These well recognized modes of inter-annual climate variation affect mid and high latitude temperatures and winter snow cover. But this is not the half of it. The influence of the circulation at the winter pole extends to the equator and the alternate hemisphere, especially in the case of the Arctic where stratospheric ozone concentration is more elevated than over Antarctica. If we imagine that this phenomenon is responsible for just the inter-annual climate variation, we reveal a blindness to the evolutionary nature of the phenomenon and its capacity to change climate over decadal and longer time scales.

The key to the evolution of surface pressure and wind is the polar night jet that  introduces NOx from the mesosphere eroding stratospheric ozone. It is most active in the winter hemisphere when coincidentally, the diminished loss of ozone by photolysis allows ozone levels to increase. But it extends into the spring and autumn and in the case of Antarctica is always active. Spatial variation in ozone concentration determines the pattern of ascent and descent.  Convection at high latitudes involves the descent of ozone into the ‘troposphere’ where it moves equator-wards dramatically affects surface pressure, atmospheric relative humidity and therefore the process of condensation that determines cloud cover, the most influential aspect of the Earth’s albedo.

It is observed here: http://www.bishop-hill.net/blog/2011/11/4/australian-temperatures.html   that it is temperature change in first half of day that is characteristic of recent climate change. It appears that almost all the warming over the last 60 years in Australia occurred between 6 am and 12 noon. Warming at this time is strongly correlated with decreasing cloud cover during the daytime and is therefore caused by increased solar insolation. Accordingly, we can observe that recent climate change proceeded from change in the Earths atmospheric albedo.

The ‘workings’ of the atmosphere at the poles is a frontier for climate science. See for instance http://www.physics.otago.ac.nz/space/2008JA014029-pip.pdf  or search on the words ‘geomagnetic activity Arctic Oscillation Index’ (without the inverted commas).

This essay offers an interpretation of the working of the high latitude atmosphere from the broadest perspective.  It takes time for unfamiliar ideas to gain traction but in truth much of what is described here is evident in the literature and is very much a part of the language of meteorology. This is not new knowledge. However, its importance is lost on those who wish to see man as the agent of climate change. This represents a triumph of ideology over observation, an everyday occurrence in the affairs of man.

If you believe that surface temperature depends upon trace gas composition via back radiation it would be best to put that idea aside while you read this paper. Observation of the manner in which the climate at the surface of the Earth changes over time suggests that the effect of down-welling radiation is swamped by the mechanism described here. Historically the globe has warmed and cooled hemispheric-ally rather than monolithic-ally, a point that is lost on those who insist on a single global metric for temperature. The process is hemispheric-ally distinctive because it is driven at the poles. The atmosphere at the two poles is distinctively different, largely due to the very different distribution of land and sea between the hemispheres. It is the difference in the  atmosphere between the poles that is important for the evolution of climate.

The Tropical Atmosphere

Viewed from space the troposphere is so thin as to be indistinguishable from the actual surface of the Earth. The Earth has a diameter  of 12,756 km. If the Earth were a mattress with a thickness of 300 mm and it were to be covered in a blanket in strict proportion that the troposphere bears to the diameter of the Earth, that blanket would be just 0.35 mm in thickness, the equivalent of five sheets of newspaper. It is the nature of the troposphere that it is hopelessly  unstable. Imagine sleeping under five sheets of newspaper with the lowest sheet removed every few seconds and replaced on top. Occasionally someone comes with a watering can to make sure that you are not overheating. The source of radiant warmth from above is lost for a variable portion of a twenty four hour cycle. Unless there is a substantial body of relatively warm water nearby, the surface of the Earth/mattress must soon get very cold. Fortunately, bodies of water have an enormous capacity to store energy and the tropical ocean is a storage organ for the Earth as a whole.

The troposphere efficiently transports energy away from the surface of the Earth via conduction, evaporation and convection. It also transfers energy laterally. But ultimately the surface of the Earth is not warmed by the troposphere, it is warmed by the ocean that traps energy from the sun.  Local temperature is primarily dependent upon the place of origin of the wind that is blowing, and whether it is from the land or the sea. The troposphere prevents the surface from overheating. So, surface air temperature is much influenced by the presence or absence of bodies of water and the extent of the sky that is cloudy.

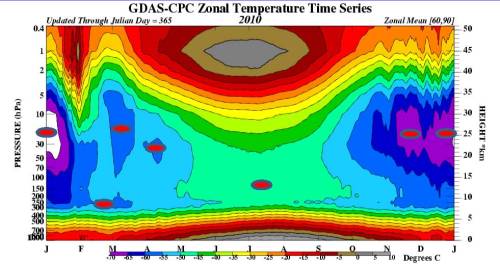
Figure 1    The temperature of the tropical atmosphere at 10°north to 10° south in 2010

Source http://www.cpc.ncep.noaa.gov/products/stratosphere/strat-trop/

From the surface, temperature declines with altitude to the 100hPa pressure level at about 15km. In figure 1 the thermal tropopause,  the point at which there is sufficient ozone to reverse the decline of temperature with altitude, is marked with red ovals. Above this point temperature increases with altitude to the stratopause at 1hPa, an elevation of 45km where the temperature can be similar to that at the surface of the Earth. In the mesosphere the temperature of the air falls away with falling ozone concentration. The diagram at upper-right is to scale but there is an error. It shows cloud in the stratosphere. In fact cloud is largely confined to the troposphere because air is de-humidified as it cools during ascent.

At 15km in elevation the tropical tropopause has a temperature of  minus 80°C. There is nowhere in the lower atmosphere (stratosphere and troposphere) where the air is colder. Even in the polar night the temperature of the air is  greater than minus 80°C. The coolness of the air at the tropical tropopause is a reflection of ozone scarcity. Ozone absorbs long wave radiation from the Earth warming adjacent molecules of air regardless of their chemical composition. This is a critical dynamic affecting the location of the tropopause. We should realize that there is no hard boundary between the ozone-sphere and the troposphere.

What accounts for the presence of absence of ozone? The atmosphere is opaque to solar radiation short of the visible wave lengths. Photolysis is the the splitting or decomposition of a chemical compound by means of light energy or photons in the short wave or ionizing spectrum.  The presence of ozone is made possible by the splitting of the oxygen molecule by short wave ultraviolet. A few oxygen atoms recombine in the O3 form. As an even larger molecule than O2, ozone is more susceptible to photolysis than oxygen.  Consequently the quantity of O3 in the stratosphere is not large,  possibly as much as 10ppm which is one fortieth the concentration of that other greenhouse gas, carbon dioxide. The formation of ozone takes place at an elevation of 30km and above. At lower altitudes photolysis is progressively weaker because of the absorption of ionizing radiation at higher elevations . If it escapes the zone of active photolysis,  ozone drifts downward but only to the extent that the movement of the air, and the antagonistic presence of water vapor will allow. In the equatorial region this down-drift is opposed by a moist updraft.

In the subtropics at 10-40° of latitude the down-drift of ozone is facilitated by the presence of dry air descending into high pressure cells in the troposphere. See figures 10 and 11 below and in particular figure 4 indicating a presence of appreciable ozone at altitudes that we consider to be within the ‘troposphere’.  The presence of ozone in the ‘troposphere’ where there is ‘humidity’ and cloud cover influences that cloud cover and surface temperature.

In the polar regions there is an intermittent tendency for the air to descend, tending to produce a very broad minimum in surface temperature in the winter months. Polar air is usually warmer than the surface. Surface pressure is higher in winter encouraging descent. As the Antarctic Oscillation Index falls (an indicator of higher surface atmospheric pressure) the atmospheric column descends bringing ozone closer to the surface. Simultaneously, the night jet at the top of the stratosphere is invigorated bringing mesospheric nitrogen oxide into the upper stratosphere, eroding ozone and cooling the upper stratosphere. So, as surface pressure rises the upper stratosphere cools and the  atmosphere below 50hPa warms all the way to the surface. Figure 2  charts the intermittent nature of that process. It is the change in surface pressure that determines the speed of the downdraft and the penetration of the night jet. Surface pressure changes on all time scales and it is itself changed by the process whereby the stratosphere and troposphere are coupled in convection.

Figure 2

Ozone as an agent for change and its distribution in low and mid latitudes

The presence of ozone in the upper troposphere/lower stratosphere is responsible for the inversion in temperature that begins at the tropopause. So, in the lower stratosphere (beneath the zone of active photolysis) we see the greenhouse effect in its most assertive manifestation and that effect is entirely due to the presence of ozone and its response to outgoing long wave radiation from the Earth.

Long wave radiation is a term used to describe the infrared energy emitted by the Earth (and its atmosphere) at wavelengths between about 4 μm and 25 μm (micrometers). Between 8 and 14 µm radiation passes readily through the troposphere.  There is also a partial window for transmission in far infrared spectral lines between about 16 and 28 µm.  Ozone absorbs round the 9.6 μm band. CO2 absorbs at a number of intervals in both shorter and longer wave lengths than ozone. A greenhouse gas that is stratified, such as ozone,  markedly enhances the greenhouse effect because it absorbs at wave lengths that would not otherwise be absorbed and promotes emission at wave lengths that can be absorbed by complementary absorbers. Consequently, the greenhouse effect is much enhanced in the stratosphere by comparison with the troposphere.

But ozone is not particular to the stratosphere. It is found below the tropopause and above the stratopause. It is carried in and out of the tropospheric domain and as we will see, it does so most dramatically and influentially at high latitudes.

It can be observed that the stratosphere exhibits hot spots above deserts where radiation is enhanced. Locally, the temperature of the stratosphere (and the troposphere where it contains appreciable ozone) depends upon both ozone content and the amount of energy in transit.

In the troposphere, ascending air cools by decompression and it gives off little radiation.  In locations where ascent is strong there is accordingly less radiation to heat the stratosphere. Secondly, in the tropics there is less ozone to absorb that radiation  due to the strength of the updraft. This accounts for the coolness of the atmosphere at 100hPa through to 50hPa in the tropics.  Note the deficiency in  radiation in near equatorial latitudes between New Guinea and Pakistan and to the East of the Gulf of Mexico. This is the fingerprint of convection.

Figure 3

While ascending air cools by de-compression, descending air warms by compression and gives off abundant radiation. For this reason the high pressure cells of the subtropical latitudes (located somewhere between 10-40° of latitude depending upon season) are potent sources of long wave radiation emanating not from the surface but directly from the atmosphere. Since these cells are larger and most potent in the winter hemisphere we have the paradox of the Earth system delivering more radiation to space from its cooler hemisphere and very little radiation emanating from the tropics where the energy from the sun is most available.

Indeed the increase in radiation in winter produces a seasonal peak in the temperature of the stratosphere at 20-30°south latitude at a time when the surface is at its coolest. See  figures 3 and 4.  It is the presence of sufficient ozone in about a third of the upper troposphere that is responsible for this seasonal maximum in upper air temperature in the middle of winter. Of course, any change in the concentration of ozone in these latitudes will affect high altitude cirrus cloud. In the last post on this blog I documented the seasonal  decline in relative humidity at 300hPa in the upper troposphere between the equator and 50° south in the middle of the year. That is a direct product of heating in the northern hemisphere because the strength of the downdraft in the southern hemisphere (and the temperature and humidity of the descending air) is related to the strength of the updraft in the north and the variable presence of ozone in  the descending air in the south.What goes up must come down.

So, the notion that ‘the troposphere is heated from the surface’, while essentially valid, takes on a different twist when the upper troposphere contains ozone. The air temperature is then determined in exactly the same way as it is determined in the stratosphere. The implications for cloud cover should be plain. This  is the essential feature of the natural climate change dynamic as it affects mid and low latitudes.

Figure 4 Temperature of the atmosphere at pressure levels 20-30° south
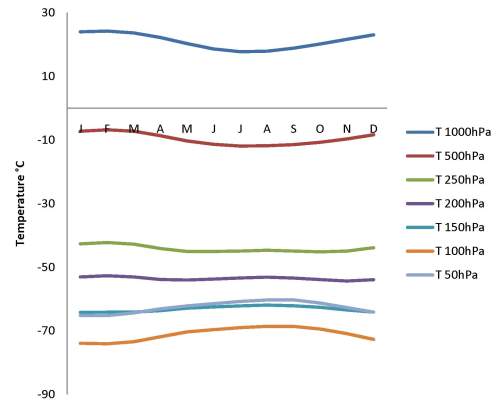
Source of data: http://www.esrl.noaa.gov/psd/cgi-bin/data/timeseries/timeseries1.pl

‘Convection’ is the term used to describe the displacement of less dense air by denser air. Any warming of the air will make it less dense. When water vapor condenses heat is released into the surrounding atmosphere. Again heat is released to the atmosphere as water turns to ice. Since water vapor is by and large confined to the troposphere, so too (except for a very important special case to be explored shortly) is convection. There is some overshooting of convection from the troposphere into the stratosphere in the tropics, especially over tropical rain forests where the supply of moisture to the atmosphere is more generous.

The fact that temperature falls with increasing altitude in the troposphere greatly assists the process of convection because a parcel of ascending air tends to be warmer than the air that surrounds it.  Convection is a countervailing force to down-welling long wave radiation so far as any effect on the  temperature of the surface is concerned. A noted already, rising air cools by decompression, not radiation. Any source of warmth expands the air and promotes convection. Convection is the defining characteristic of the troposphere. It has the effect of moving energy from low to high  in the troposphere, from the summer to the winter hemisphere and at the surface displacing warm moist air polewards. The assertion that down-welling radiation from increased greenhouse gas will warm the surface flies in the face of our knowledge of the physical processes at work in the troposphere. It is a product of religion, not science. Hence the inappropriate demonization of carbon dioxide.

It is very clear from the map above that the southern hemisphere  radiates strongly in winter. Were there a viable greenhouse effect, it would do a lot of good by warming the surface of the southern hemisphere in winter reducing the diurnal and annual range of temperature, especially over land. The annual range of temperature is indeed much truncated in the southern hemisphere, due to this effect (working to reduce cloud cover) and also the ratio of land to sea.

Does the stratosphere have water vapor? Clouds do occur in the stratosphere, especially in the tropics and subtropics where convection is strongest. Is water vapor in the stratosphere antagonistic to the existence of ozone? According to Greg Shindel at NASA “Water vapor breaks down in the stratosphere, releasing reactive hydrogen oxide molecules that destroy ozone. These molecules also react with chlorine containing gases, converting them into forms that destroy ozone. So a wetter stratosphere will have less ozone.” http://www.giss.nasa.gov/research/briefs/shindell_05/

Ozone in the polar atmosphere and the mobile ‘tropopause’

Can we speak of a ‘tropopause’ at high latitudes? The summer and winter situations are very different but in neither instance will we find a tropopause at 7 km in elevation as suggested by Wikipedia, not even an ‘indistinct’ one.  Is there convection in the polar troposphere? Yes.  There is no boundary to convection in the high latitude atmosphere. At high latitudes the atmosphere is heated in a top down rather than a bottom up fashion. It is at the top of the atmosphere that we find the agent of heating and convection, ozone in relative abundance. There is no heating to be had at the surface.

There is very little water vapor in the polar atmosphere to help us distinguish between ‘troposphere’ and ‘stratosphere’. Most of the moisture is squeezed out of tropical air in its transit from the equator. Accordingly the polar surface at high latitudes is a cold desert. Incidentally, it is just as well that the air is dry by the time it gets to the pole, otherwise more of the ocean would be permanently locked up in the polar ice cap. Does the extent of the polar ice cap (and sea level) primarily reflect the strength and humidity of the mid latitude westerlies? Is the extent of polar ice simply a function of the balance between accretion and depletion. But let me not be distracted.

Deprived of sunlight in winter one might imagine that the polar stratosphere might lose its ozone and become extremely cold. The reverse is the case. Photolysis by sunlight is the chief natural cause of ozone degradation. In a winter regime of zero  photolysis, ozone accumulates in the polar stratosphere  as is clearly apparent in figures 6 and 7. It is also apparent that ozone tends to be diminished in the low and mid latitudes of the winter hemisphere via the process of wasting into the high pressure cells of the mid latitudes in the winter hemisphere and this is clearly evident in the northern hemisphere.

Figure 6

Figure 7

Source: http://ds.data.jma.go.jp/gmd/jra/atlas/eng/atlas-tope.htm

The entire atmospheric column at the pole is below freezing point. On the face of it this, might be expected to produce a relatively still atmosphere. This is not the case. High latitudes experience destructive winds, especially in Antarctica, and on a more consistent basis than elsewhere. Strong wind is due to extreme pressure gradients. The manner in which extreme pressure gradients are created is unique to this part of the globe. The presence of ozone in the troposphere causes heating. But ozone is unequally distributed. The warmest parts of the stratosphere naturally ascend and the coolest parts descend into the domain of the ‘troposphere’, and in particular over the ocean. The presence of ozone causes a reduction in the number of molecules in the atmospheric column. Surface pressure falls. The lowest surface atmospheric pressure on the globe is to be found, not where the sun shines brightly, but at high latitudes where the sun is weak and the Earth itself is the source of radiation that heats the air. See figure 14 below.

In the upshot, as w see in figures 6 and 7  there is a very strong gradient in ozone concentration between the mid latitudes (low) and the Arctic and Antarctic circles (high) in the winter hemisphere. When the polar circulation forces ozone into the troposphere it makes for a dynamic situation with very strong gradients in surface pressure. This enhances wind strength in winter.

Figure 8
The process of convection at high latitudes is assisted by the upward movement of the ‘cold point’ in winter. In the Arctic summer in mid year the cold point lies somewhere between 8 and 20km in elevation (Figure 8). Yes, if this is the ‘tropopause’ it is manifestly ‘indistinct’. Actually, this thermal profile indicates that the process of convection that we associate with the troposphere would be readily extended into the stratosphere were the source of warmth to be associated with the surface. But, it is actually not associated with surface phenomena at all. It is associated with the presence of ozone.   Accordingly the dynamic behind the degree of convection is the ozone content of the upper stratosphere.

Dynamics in the stratosphere

The night jet introduces nitrogen oxides from the mesosphere into the stratosphere between 1 and 50hPa, eroding ozone in summer and winter, with a bias towards stronger activity in the high pressure regime of winter.

In winter and spring the cold point moves up and down between 300hPa and 20hPa like a yo-yo. We see in figure 8 that the cold point can not be considered to mark the transition between a ‘troposphere’ and ‘stratosphere’. These terms have no application in the very different atmosphere at high latitudes.

In figures 9 and 10 we see that the temperature of the Arctic stratosphere at 5hPa  gyrates in winter/spring in a spectacular fashion.   In figure 9 the warming events are marked with red arrows (Arctic) and green arrows (Antarctic). Each warming event is associated with a decline in the temperature of the equatorial stratosphere at 5hPa. It is also associated with an increase in the AO as seen in 10. To see this connection please relate the timing of the warming episodes marked with green (Antarctic origin) and red (Arctic origin) lines in figure 9 to the timing of the increases in the AO as documented in figure 10. Since the AO relates to change in polar atmospheric pressure we can observe that  every warming episode is due to a fall in polar surface pressure  and a collapse in the night jet.

Figure 9

Source: http://www.cpc.ncep.noaa.gov/products/stratosphere/temperature/

It is apparent that the change in the temperature of the polar stratosphere has global implications for wind force and direction, including the Pacific Ocean where ENSO relates to a surface pressure oscillation. The notion (in UNIPCC type climate science) that heating of the upper stratosphere at the poles it is driven by ‘planetary waves’, ‘gravity waves’ or ‘heat flux from lower latitudes to high latitudes’ is nonsense. The heating of the atmospheric column is time specific, seasonal in occurrence, it relates to the presence or absence of NOx from the mesosphere and change in the surface pressure regime as represented  in the AO and the AAO indices.  Nowhere in science is there are more dramatic illustration of the impact of ideology in determining ‘orthodoxy’. The effect is to rule out of consideration the process by which the sun causes change in surface wind, air temperature and precipitation. The proponents of UNIPCC simply do not wish to know about this dynamic.

Figure 10

The global nature of this dynamic is apparent in the association of figures 9 and 10.  We need to understand this if we wishe to understand how the climate can change change naturally. A rise in the AO (fall in atmospheric pressure at high latitudes) corresponds with the warming event in the upper polar stratosphere and a cooling event in the lower polar atmosphere. It is  coincident with a marked cooling of the middle and upper stratosphere over the equator. As we will see it is also associated with an increase in the intensity of solar radiation reaching the ocean in mid latitudes. Simultaneously there is a reduction in atmospheric pressure at  about 60° of latitude, an increase in pressure at about 30° of latitude and therefore a stimulation of the westerly winds.

Summarizing:

  • Fall in the AO (rising polar pressure) = abrupt increase in the temperature of the lower polar atmosphere and simultaneous  fall in the temperature of the upper polar atmosphere as the penetration of the night jet is enhanced. This is associated with an abrupt  increase in the temperature of the equatorial upper stratosphere as the equator loses atmospheric mass, pressure falls there as it rises at the pole.
  • Rise in the AO (falling polar pressure) = abrupt fall in the temperature of the lower polar atmosphere as the temperature of the upper polar stratosphere increases due to the night jet stalling. This is accompanied by a fall in the temperature of the upper equatorial stratosphere as the equatorial atmosphere gains mass. The increase in the temperature of the upper polar atmosphere is referred to as a sudden stratospheric warming. It is associated with enhanced ozone content. Such a warming is documented in late January 2011 in figure 8 and in August, September and October in figure 11.

These dynamics have been described as the Northern Annular mode and the Southern Annular mode of inter-annual climate variation. See http://www.atmos.colostate.edu/ao/introduction.html

Unique features that energize the Antarctic polar circulation

Figure 11

In the Antarctic the surface is colder than the Arctic all year round. The cold point is elevated for a longer period than it is in the Arctic. Looking at the lowest panel of figure 9 there is a weaker (than the Arctic) but persistent variation in the temperature of the upper atmosphere at 5hPa over nine months of the year. Only between February and April is this variation diminished. The persistence of the night jet over a longer period each year is associated with a diminished level of ozone in the southern stratosphere. That same relatively invariable persistence is also associated with a reduced incidence and intensity of ‘stratospheric warmings’.

The nature of the Antarctic atmosphere has changed dramatically over time.

Figure 12 The temperature of the stratosphere at 80-90°south in September. °C
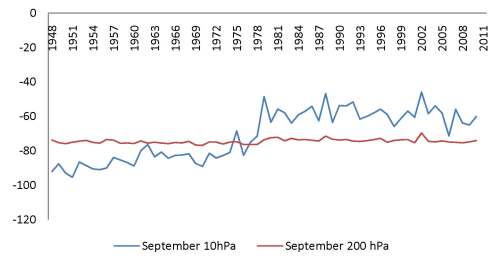
Since 1948 the temperature at 10hPa in September has increased strongly  while that at 250hpa is stable. The increase in the temperature at 10hPa relative to 200hPa indicates enhanced thermal contrast in the upper ozone-sphere, favoring the overturning circulation. The increase in temperature aloft is consistent with the progressive decline in surface atmospheric pressure south of 50°south with compensating gain in pressure between 50° south and 50° north. This change in atmospheric pressure is documented in figure 14. It represents the unobserved gorilla in the climate change room. This gorilla is invisible in ‘climate science’ as it is propagated in the works of the UNIPCC.

Figure 14 Pressure Loss /Gain according to latitude between the first and last decades of the period 1948 -2011

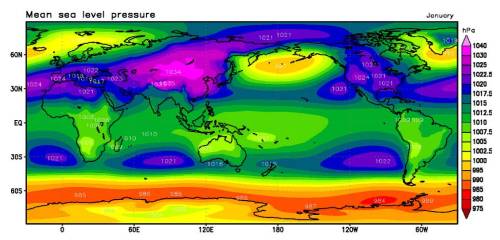
The churning of ozone into the lower atmosphere  produces the pattern of surface pressure that we see in figures 15 and 16. Notice the band of extremely low surface pressure on the margins of Antarctica and lesser zones in the North Atlantic and North Pacific.

Figure 15

Source: http://ds.data.jma.go.jp/gmd/jra/atlas/eng/atlas-tope.htm

The evolution of surface pressure in the northern hemisphere is plainly affected by the presence of the Eurasian land mass where temperature swings more wildly than it does over the sea. We see high pressure on the land in winter and low pressure in summer. In northern winter, low pressure anomalies (associated with ozone descent) affect latitudes  between 50-60°north in particular over the North Pacific and North Atlantic. This is the location where the coupled circulation injects ozone into the lower atmosphere  producing a tell tale pattern of sea surface temperature anomalies in mid latitudes.

In the southern hemisphere the coupled circulation produces a near continuous zone of low surface pressure on the margins of Antarctica that deepens in winter.

Figure 16

Source: http://ds.data.jma.go.jp/gmd/jra/atlas/eng/atlas-tope.htm

For an animation of global sea level pressure courtesy of Paul Vaughan see http://i54.tinypic.com/swg11c.png The animation shows the strong role of the Eurasian land mass in determining surface pressure in the northern hemisphere. Notice the seasonal increase in surface pressure over Antarctica in winter and the relatively invariable zone of low pressure on its margins.

The waxing and waning of surface pressure at 60-70° south is responsible for the variation in the strength of the westerly winds in the southern hemisphere that we see in Paul’s animation at: http://i52.tinypic.com/nlo3dw.png.  Isotachs are lines of equal wind speed. Notice the  increase in the strength of the westerlies in winter in the zone between South Africa and Australia consistent with the presence of the persistent ozone anomaly in this area, a feature that is likely connected with the phenomenon known as the Indian Ocean dipole.

Obviously there is a strong variability in surface pressure at 60-70° south (ozone churn zone) from month to month and across the year. That variation is due to changing ozone content of the polar stratosphere and change in the patterns of convection that are due to this variation. Once initiated the process of ozone churn actively lowers pressure between 50° of latitude and the pole. This reduces night jet activity allowing ozone content to further increase. In other words there is a powerful feedback mechanism. It is this feedback that has robbed the southern hemisphere of atmospheric mass at mid to high latitudes over the last sixty years.

The coupling of the stratosphere and the troposphere at the poles is continuous, albeit weaker in summer than winter. We know this from the pattern of geopotential heights (warmed air) produced in the upper troposphere. By charting the GPH anomalies we  observe the effect of the coupled circulation at the poles on the upper troposphere at any time of the year.

Figure 16


Source: http://www.cpc.ncep.noaa.gov/products/intraseasonal/z200anim.shtml

The warming and drying influence of ozone on the upper troposphere, plainly affecting cloud cover and sea surface temperature, propagates towards the equator as we see below. Ozone is carried towards the equator by the counter westerly flow in the upper troposphere destroying ice cloud as it moves and allowing the ocean to warm. There are plainly many centers of activity in the southern hemisphere at 20-30° south. Relative stability in the geographical spread of these locations of enhanced ozone descent produces the pattern of global sea surface temperature anomalies that is characteristic of ENSO.

Figure 17 Association of geopotential height anomalies at 200hPa with sea surface temperature anomalies
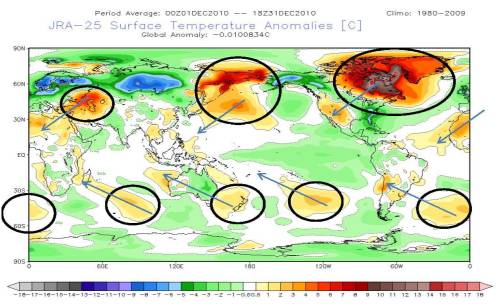
The  warming of the sea in mid and low latitudes is directly associated with the fall in polar pressure on the margins of Antarctica. It is therefore associated with with an increase in the speed of the westerly winds and enhanced evaporation from the sea surface, a phenomenon particularly marked in the southern hemisphere. So, the sea surface temperature response in the southern hemisphere is muted by the evaporation response, a phenomenon much less evident in the northern hemisphere.

Figure 14, showing the loss of atmospheric pressure over time tells us that the stronger circulation is in Antarctica. The Arctic circulation is disrupted by heating of the northern land masses in summer. The relative lack of ozone churn in the Arctic stratosphere is reflected in higher stratospheric ozone values, weaker westerly winds and weaker polar easterlies. However this background of high ozone and weak wind strength is associated with strong changes in the domain occupied by the surface winds when quite small change in surface pressure occur. The change in  pressure relations between mid and high latitudes has long been monitored as the Arctic Oscillation. When polar pressure is high the cold polar Easterlies sweep well south into former domain of the westerlies. When pressure is low the westerlies sweep further north and winters are much more benign. This is THE climate change dynamic that produces the swing in winter temperature in the northern hemisphere that repeats at regular intervals. 1960-78 cooling. 1978-2007 warming. Post 2007 cooling.

A brief note on the night jet

A picture is worth a thousand words.

1. As we have seen in relation to figure 9 and 10 the activity of the night jet varies with atmospheric pressure. See also: https://climatechange1.wordpress.com/2011/09/08/a-climate-change-dynamic/

2. It is known that the concentration of nitrogen oxides in mesospheric air depends upon solar activity.

3. There is a well documented relationship between geomagnetic activity and change in the surface pressure relationship between mid and high latitudes in winter (documented as the Arctic and the Antarctic Oscillation Indexes).

Consider now:

Figure 18

Source http://www.cpc.ncep.noaa.gov/products/stratosphere/strat_a_f/

Figure 18 shows the effect of the night jet on the ozone concentration of the upper stratosphere in August 2011 an elevation of  roughly 43 km. In the core you see a zone of 5.5 to 6 ppm ozone. On the margins of Antarctica ozone attains 8.5 to 9 ppm and over the Pacific peaks at 11to 11.5 ppm ozone. The evolution of the night jet is the primary control on ozone content of the polar stratosphere. The extent of wasting of ozone into the troposphere is the secondary mode of control, and probably more influential, especially in the southern hemisphere. There may be other influences, perhaps related to the number of aerosol cans and fridges delivered to municipal rubbish tips, but in the big scheme these influences have been and continue to be inflated by hysteria, agenda driven politics and the demand for research funding by egocentric academics dedicated to a particular view of the world. That view of the world sees man as ‘the problem’.

Why is the coupled circulation over Antarctica so much stronger than it is over the Arctic? The southern hemisphere lacks the mass of land that exists in the northern hemisphere to warm the atmosphere in summer and disrupt the polar circulation.

Summary

The polar circulation injects ozone into the high latitude lower atmosphere. With little water vapor the atmosphere at high latitudes possess few of the properties of the low or mid latitude troposphere. It is this perturbation in ozone content affecting the weight of the atmospheric column (and surface pressure) that changes the wind, the cloud and surface temperature on the inter-annual, decadal and centennial time scales. It does this by changing the concentration of the one greenhouse gas that is beyond the influence of man. The presence of absence of ozone in the cloud zone is a matter for the sun and the atmosphere in a complex dance that challenges our imagination. It is the electromagnetic influence of the sun, depending upon plasma density within the neutral atmosphere that initiates a redistribution of the atmosphere and starts a process that includes a strong feedback mechanism. The feedback mechanism is in turn dependent on the night jet and surface pressure. It is the activity of the sun that determines the chemical constitution of mesosphere air that is drawn into the tenuous upper atmosphere over the poles. It is the sun that ultimately controls this circulation. The Earth system greatly amplifies the tiny stimulus that the sun applies to the tenuous upper atmosphere.

In this way the cloud comes and goes. Global cloud and high altitude ice cloud in the southern hemisphere is most abundant between November and March when the Arctic circulation is influential.  It is at this time when the Earth is closest to the sun that the most vigorous variation in the  El Nino Southern Oscillation is seen.  If we look deeper, we see a strong dependency of the Arctic circulation on the Antarctic. On the shortest time scale the Arctic circulation is frequently a mirror image of that in the Antarctic. On the longest time scale the AO moves with the AAO. The AAO sees by far the largest swings on decadal and longer time scales. The Antarctic is not only the strongest circulation, it is the least studied.

One can restate this argument in a slightly different way. An ozone feed to the troposphere from either pole changes high altitude ice cloud density. Observation reveals that surface temperature varies most widely between November and March when the Arctic circulation is most active. See https://climatechange1.wordpress.com/2011/10/03/where-is-science/ It is at this time we see the greatest fluctuations in the Southern Oscillation index that reflects pressure variation between Tahiti and Darwin.The Southern Oscillation Index leads all sea surface temperature indices. Surface pressure change has its origin in change in the AO and the AAO.

What is described here is a natural climate change dynamic that represents the primary mode of climate variation affecting the Earth system.  To the extent that temperature in the tropics is aligned with change in surface pressure (it is) you know that this factor is influential. The primacy of the Antarctic in terms of its influence on surface pressure indicates that the Antarctic is ‘The Main Player’ with the Arctic acting as the necessary intermediary in mediating the process of change.

The oft repeated proposition that change is initiated at low latitudes and propagates towards the poles is precisely 180° out of whack. When we speak of the influence of ENSO on global temperature we are actually looking at the product of polar processes.

Note:  For a detailed analysis download the document at  http://www.happs.com.au/images/stories/PDFarticles/TheCommonSenseOfClimateChange.pdf

Earlier posts on this topic can be accessed at  https://climatechange1.wordpress.com/2011/01/17/earths-changing-atmosphere/ and earlier at https://climatechange1.wordpress.com/2009/11/08/the-climate-engine/

Posted by: erl happ | October 23, 2011

High level cloud and surface temperature

The orbit of the Earth’s around the sun is slightly eccentric. The closest point is called the perihelion. On January 4th the Earth is just 147,098,291 km away from the sun. Aphelion occurs July 4th when the Earth is 152,098,233 km away from the sun, a difference of +3.3%. Naturally the power of the sun falls away with distance. It’s radiation is 7% weaker in July than in January.  The near surface air temperature for the Earth as a whole is 3.3°C warmer in July than in January. The northern hemisphere is rich in land and the southern hemisphere rich in sea. The land returns energy to the atmosphere. The sea stores energy.

As the air warms in mid year it is likely to be drier and less cloudy because evaporation lags the temperature increase. Cloud cover increases in the northern hemisphere as the atmosphere  warms but the loss of cloud in the southern hemisphere as the south cools is much greater than the gain of cloud in the northern hemisphere.  So, on a global basis cloud cover falls  in mid year by 3%.  Total cloud cover tells us very little about global albedo because different types of clouds vary in their albedo. Some cloud is said to trap radiation and warm the surface and this type changes a lot. So the cloud cover statistic tells us little about the state of cloud albedo or its radiative impact.

This post explores where,  why and what sort of  cloud is lost as the global atmosphere warms in mid year. There is a heavy loss of high level cloud in the southern hemisphere. The manner in which this occurs  is interesting. It informs us as to the artificiality of our notions of what constitutes the troposphere and the stratosphere and the dynamics of the system that determines surface temperature and its variability over time.

All data for the graphs from http://www.esrl.noaa.gov/psd/cgi-bin/data/timeseries/timeseries1.pl

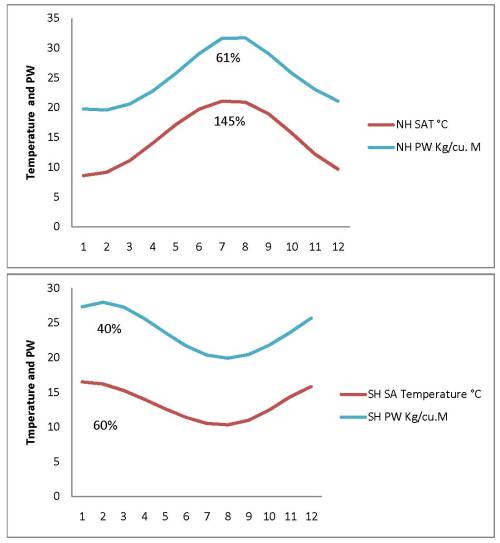
Figure 1 Surface air temperature (°C) and precipitable water (kg/m^2). Percentage change between minimum and maximum is indicated.

The increase in precipitable water lags the temperature increase by a couple of months. There is plainly more variability in the land rich northern hemisphere.

The maps below come from the invaluable JRA-25 Atlas at: http://ds.data.jma.go.jp/gmd/jra/atlas/eng/atlas-tope.htm

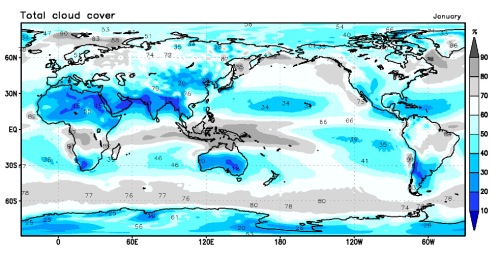
Figure 2 Total cloud cover January

Figure 3 Total cloud cover July

It is evident that all the driest parts of the land  in both hemsipheres have less cloud in July than they do in January. These locations are sources of potent surface radiation.  There is less cloud as a whole in July (more dark blue) than in January. There is more dark blue between the equator and 30° south in southern winter (July) than in summer. But what type of cloud is lost?

Cloud is classified according to elevation:

High cloud 7.6km to 12 km (300hPa to 150hPa)

Medium level cloud 2.4 to 5.5km  (700 to 400hPa)

Low cloud below 2.4km. Below 700hPa.

Figure 4 Annual cycle of relative humidity at 10-30°south and 10-30°north at 925hPa (near surface) and at 300hPa (8km)

In the topmost figure we see a marked reduction in relative humidity at 300hPa at 10-30° south in mid year.  The same latitudes in the northern hemisphere experience an increase in relative humidity in mid year.

In the lowest figure we see only a slight reduction in relative humidity at 925hPa affecting the last half of the year. However there is a loss of humidity at 700hPa, 500 hPa and 300 hPa in the middle of the year increasing with altitude. Notice that humidity at 300hPa generally exceeds that at 700hPa and 500hPa.

Figure 5 Relative humidity between 50°north latitude to 50° south latitude

Figure 5 aggregates data for all latitudes between 50° north and 50° south.  We see a marked trough in relative humidity at 300hPa between April and November. This establishes that the main inter-seasonal dynamic occurs in the upper troposphere. But at what latitude?

Figure 6 Relative Humidity by latitude and altitude

It is plain that the mid year loss of humidity at 300hPa that characterizes the latitude 50°north to 50° south as a whole is is driven by marked change in the southern hemisphere.

Why is it so?

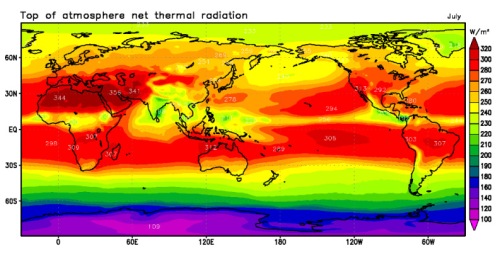
Figures 7 and 8 illustrate the point that the great high pressure cells of the Hadley circulation produce copious amounts of thermal (infrared) radiation colored red. This is particularly the case in the winter hemisphere. Here is a conundrum. Why do the subtropical latitudes of the winter hemisphere give off more radiation when the surface is cooler than when it is warmer?

First, what’s a Hadley cell?  At the equator the air ascends. As it ascends latent heat is released, the air becomes less dense is driven upwards and in the process it cools via decompression. Hence the paucity of outgoing radiation in near equatorial latitudes. The warm waters between India and New Guinea give off little radiation but they deliver much evaporation.    Air that ascends at the equator ultimately returns to the surface at 10-40° of latitude. It descends over cool surfaces that support the process of descent by cooling the surface air. Extensive high pressure cells circulate anticlockwise in the southern hemisphere and clockwise in the northern hemisphere giving rise to the trades and the westerlies. These cells are largely free of low and middle troposphere cloud. The air in these cells warms via compression, the bike pump effect. So, as these high pressure cells occupy more space over land and sea in the winter hemisphere the surface must receive more direct sunlight and the winter hemisphere at these latitudes must be warmer than it otherwise would be.

Figure 7 July outgoing long wave radiation

Figure 8 January outgoing long wave radiation

It is apparent that atmospheric processes determine where thermal radiation is released by the Earth system. It is released from the atmosphere rather than directly from the surface. The area of cloud free sky tends to be enhanced in winter. This must be considered a positive. We like to be warmer in winter. If this is what the greenhouse effect is all about I am all for it. But hang on, the greenhouse effect must be quite weak because there is little chance of water vapor amplification in dry air. What a bummer.

Figure 9 Air temperature at various elevations at 20-30°south

Figure 9 shows that the temperature of the upper troposphere at 20-30° south responds to enhanced radiation in winter just like the stratosphere at 50hPa.  The response depends upon the ability of ozone to trap long wave radiation at a quite specific wave length, 9.6 micrometers. Infrared spans 4-28 micrometers. We see a strong response to just a small part of the total spectrum by a mass of tiny little radiators that populate this part of the atmosphere in the parts per billion range but sufficient to invert the seasonal temperature profile. Hang on, this is not in the rule book, the troposphere is supposed to be warmed from the surface and should move with surface temperature! But here we see the upper troposphere acting like the stratosphere in that it responds to long wave radiation. Do we need to alter our ideas of where the stratosphere starts? Where is the ozone tropopause?

A winter warming response at 250hPa,  involving  a marked loss of relative humidity in the ice cloud zone involves a disconnection of moisture supply from the temperature dynamic in the upper southern troposphere. Quite possibly, the supply of moisture to the upper troposphere in the southern hemisphere is cut off by the northward migration of the inter-tropical convergence and the cooling of the tropical seas at this time.

Climatologists have long wondered why a 1°C increase in temperature at the sea surface relates to as much as a 3° increase in temperature of the upper troposphere. They call this phenomenon ‘amplification’ as if the temperature of the upper troposphere in some way depended on the temperature at the surface.  The presence of a long wave absorber namely ozone, is responsible for this phenomenon. The warming of the upper troposphere results in cloud loss and because of this, the surface temperature increases.

In the mid and high  altitude parts of the troposphere cloud is present as highly reflective interlacing micro-crystals of ice that we describe as cirrus and stratus. When the air warms these crystals sublimate. Ice cloud is the dominant cloud of the subtropical region. In IPCC climate science high altitude ice cloud is supposed to warm the surface by enhancing back radiation.  But when radiation from the atmosphere increases in winter relative humidity falls. This radiation it is not bounced back by the cloud, the cloud disappears and lets the sun shine through. The surface temperature response is due to the disappearance of the cloud, not back radiation. Oops.

Figure 11 High cloud cover in January and July Source JRA-25 Atlas at http://ds.data.jma.go.jp/gmd/jra/atlas/eng/atlas-tope.htm

Figure 11 shows the latitudes of the southern hemisphere where high cloud is evaporated in July. There is a marked expansion in the area that has less high cloud  by comparison with January.

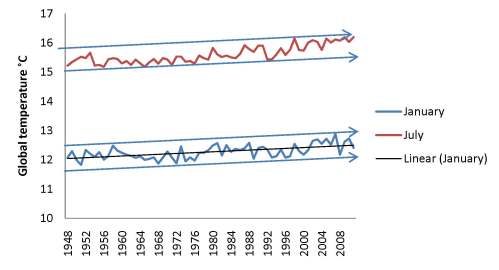
Figure 11 The advance of global temperature in January and July


Figure 11 indicates that there is more year to year variability in the minimum global temperature  (January) than the maximum (July).

The minimum is experienced when the Earth is closest to the sun. The Earth is coolest at this time because the southern oceans absorb solar radiation without warming the air and the atmosphere is cloudier in January. January is characterized by a relative abundance of high ice cloud in the southern tropics. Relative humidity peaks in April (figure 6) when tropical waters are warmest. I suggest the variation in the minimum global temperature is likely due to change in high altitude cloud.  The southern hemisphere experiences the largest flux in ice cloud.That flux in high cloud is likely to be due to change in the ozone content of the upper troposphere.

You would have to be very naive to think that the inter-annual  change in temperature that is most obvious between November and March could be due to something other than a change in cloud cover in response to a change in upper tropospheric ozone. Lets look therefore at the temperature of the upper troposphere at 20-30° south in the context of temperature change over time/ Is this the canary in the coal mine?

Figure 12 Temperature of the sea and the upper troposphere at 250hPa at 20-30° south in January.

Figure 13 Temperature of the sea and the upper troposphere at 250hPa at 20-30° south in July.

In January we observe a close relationship between the temperature of the upper troposphere at 20-30°south and the temperature of the sea. The so called ‘amplification factor’ is plainly there.

In July we see a decline in 200hPa temperature between 1948 and 1978 in line with the decline in the temperature of the northern hemisphere during that interval. There is a strong increase in 200hPa temperature after 1978 as the northern hemisphere warmed strongly. We know that the temperature of the stratosphere at 20-30°south is linked to the extent of warming in the northern hemisphere in mid year. The greater the convectional updraft that occurs north of the equator in mid year, the more voluminous is the stream of air that descends in the winter hemisphere. So, as the north warms the greater will be the outgoing radiation and the warmer will be the stratosphere and the upper troposphere in the southern hemisphere. The warmer it is, the less extensive must be the reflective ice cloud umbrella.

Figure 14 Anomalies in temperature at 200hPa, 300hPa and at the sea surface 20-30° south. Three month moving averages of monthly data.

Looking now at the monthly anomaly (departures from the 1948-2011 monthly average) the dependance of surface temperature upon  upper troposphere temperature is plain to see. In a cooling cycle we see 200hPa temperature falling below 300hPa and sea surface temperature and rising above in a warming cycle. It is plain that the upper troposphere leads the way. The shift of in 200hPa temperature between 1976-1980 had its origins in the increase in the temperature of the entire Antarctic stratosphere at that time led by change over Antarctica. It is this that is responsible for the  warming in the tropics and in part the northern hemisphere.

Background

The $64,000 question is what causes the change in the ozone content of the high cloud zone between November and March when the greatest variability in global surface temperature is seen.

The $164,000 question is what is causing cloud cover to rise and fall on  decadal and centennial time scales.

The answer to both questions lies in the activity of the coupled circulation of the stratosphere and the troposphere at the poles that feeds ozone into the troposphere. The upper troposphere warms or cools depending upon the feed rate of ozone. The feed rate changes over time.

The ozone content and temperature of the upper stratosphere depends in the first instance upon the activity of the night jet at the poles that introduces NOx from the mesosphere. Less NOx means more ozone.  The activity of the night jet depends upon surface pressure and the concentration of NOx in the jet depends upon solar activity. In Antarctica, surface pressure has been falling for sixty years indicating a continuous increase in the ozone feed into the troposphere, the second major influence upon the ozone content of the polar stratosphere.

In that the coupled circulation of the stratosphere and the troposphere over Antarctica changes surface pressure at 60-70° south it changes the strength of the westerly winds in the southern hemisphere,  cloud cover and surface temperature on all time scales. Stratospheric ozone is wasted above and below the stratosphere, processes referred to as ‘unknown dynamical influences’ in the more respectable polar ozone studies.

These phenomena are the very essence of the Southern Annular Mode, arguably the fundamental mode of global climate variation on all time scales.

One thing is plain. High altitude ice cloud in the southern hemisphere is plainly a reflector of solar radiation. It does not promote warming (positive feedback). It promotes cooling (negative feedback). It’s presence depends upon the flux in ozone in the upper troposphere as governed by processes in the Antarctic and the Arctic stratosphere. These processes are tracked as the Arctic Oscillation and the Antarctic Oscillation indices that are acknowledged in more enlightened circles as prime modes of inter annual and longer term climate variation.

Suggested reading

Click to access The%20arctic%20oscillation%20signature%20in%20the%20wintertime%20geopotential%20height%20and%20temperature%20fields.pdf

Click to access Buermann.pdf

http://www.appinsys.com/globalwarming/AO_NAO.htm

http://www.islandnet.com/~see/weather/almanac/arc2011/alm11jan.htm

Posted by: erl happ | October 3, 2011

Where is Science?

The Southern Oscillation Index is a reference point for the strength of the Trade winds. It represents the difference in atmospheric pressure between Tahiti and Darwin. In figure 1 the SOI is the red line with its values on the right axis. A negative SOI reflects slack trade winds and a warming ocean. A positive index relates to a cooling globe. Note that the right axis in figure 1 is inverted.

How is it that change in surface atmospheric pressure is so closely associated with a change in the temperature of the tropical ocean? This is the major unsolved riddle in climate science. If temperature is so obviously associated with pressure on an inter-annual basis why not in the long-term? In this article I show that pressure and temperature are intimately related on all time scales. In other words, ENSO is not an ‘internal oscillation of the climate system‘ that can be considered to be climate neutral. ENSO is climate change in action. You can’t rule it out. You must rule it in. Once you do so, the IPCC assertion that the recent increase in surface temperature is more than likely due to the works of man is not just ‘in doubt’, it is insupportable.

If the IPCC can’t explain ENSO it can not explain climate change. It is not in a position to predict surface temperature. Its efforts to quantify the rise in temperature must be seen to be nothing more than wild imaginings. Its prescriptions for ‘saving the planet’ must be viewed as ridiculous.

Surface pressure data: http://www.longpaddock.qld.gov.au/seasonalclimateoutlook/southernoscillationindex/soidatafiles/index.php. Monthly temperature data: http://www.esrl.noaa.gov/psd/cgi-bin/data/timeseries/timeseries1.pl

Temperature change is linked to change in surface atmospheric pressure

Figure 1 Left axis Temperature in °C. Right axis three month moving average of the monthly southern Oscillation Index

The Southern Oscillation Index leads surface temperature on the upswing and also on the downswing. Some factor associated with change in surface pressure is plainly responsible for temperature change.

How and why does atmospheric pressure change?

The evolution of surface pressure throughout the globe depends upon the activity of the coupled circulation of the stratosphere and the troposphere in Antarctica and in the Arctic. These circulations have become more aggressive over time resulting in a loss of atmospheric mass in high latitudes and gain at low latitudes. The gain at low latitudes reflects the seasonal pattern of increased intensity in the respective polar circulations. The stratosphere and the troposphere couple most intensely in February in the Arctic and in June through to September in the Antarctic. The pattern of enhanced activity at particular times of the year is reflected in the timing of the increase in sea surface pressure in equatorial latitudes, as seen in figure 2.

Figure 2 Gain in average monthly sea level pressure between the decade 1948-1957 and the decade 2001-2010. hPa

Note that in the first half of the year when the Arctic is active surface  pressure has increased more in the north than the south. The reverse is the case after July.

The coupled circulation in the southern hemisphere produces a deep zone of low pressure on the margins of Antarctica that encircles the entire globe as is clearly evident in figures 3 and 4. In previous posts I have documented the change in high latitude pressure since 1948 and the associated change in wind strength, sea surface temperature and by inference, since the atmosphere is warmed by the descent of ozone into the troposphere, a change in cloud cover.

Figure 3 Mean sea level pressure January

Figure 4 Mean sea level pressure July

The pressure deficit on margins of Antarctica is deepest in July (winter) as is the pressure gradient between the interior of Antarctica and the southern Ocean .

It is of interest therefore to look at the evolution of the pressure relationship between Tahiti and Darwin (that is the essence of the SOI) over time.

Bear in mind that as atmospheric mass moves from high latitudes to the equator atmospheric pressure increases at Darwin more than it does at Tahiti and the trade winds slacken. The increase in pressure at Darwin is well correlated with the increase in atmospheric pressure in equatorial latitudes globally. The plunge in atmospheric pressure at high latitudes that enables the increase in pressure at the equator is associated with cloud loss and increased sea surface temperature in mid and low latitudes. The most abbreviated explanation of mechanism behind the loss of cloud can be found here: http://wattsupwiththat.com/2011/08/20/the-character-of-climate-change-part-3/

Figure 5 Thirty day moving average of the difference in daily sea level pressure between Tahiti and Darwin hPa.

The excess of pressure in Tahiti with respect to Darwin over the period 1999-2011 is shown in figure 5. The pressure differential plainly evolves over time and an indication of the direction of change is given by the polynomial curve.

Secondly, we can see that the pressure differential exhibits a pattern of seasonal variation. In general the pressure differential is high at the turn of the year and low in mid year.

The pattern of the average daily differential for the entire period for which daily data is available (1992 -2011) is shown in figure 6.

Figure 6 Average daily sea level pressure differential between Tahiti and Darwin over period 1992-2011. hPa

We observe that the pressure differential between Tahiti and Darwin:

• Reflects strong variability even when averaged over a period of twenty years.

• Is greatest between late December and the end of February (strong Trade winds)

• Is least between April and September (weak Trade winds).

• Shows a pattern of enhancement in February- March and also in September- October that plainly relates to the pattern of pressure increase in near equatorial latitudes evident in figure 2. The shift in the atmosphere away from Antarctica tends to enhance the pressure differential driving the trade winds all year, but in particular in September and October. So far as the Arctic is concerned the pressure loss is centered on February and March.

Why do the trades tend to fail in mid year?

Figure 7 Sea level pressure hPa. Seasonal pattern in Tahiti and Darwin.

The erosion of the pressure differential in southern winter relates to the establishment of a high pressure zone over the Australian continent. Compare figures 3 and 4 noting the difference in atmospheric pressure over Australia in summer and winter.

Evolution of the pressure differential (and the trade winds) between solar minimum and maximum in cycles 23 and 24

The low point between solar cycle is frequently marked by La Nina cooling. As geomagnetic activity picks up the first and usually the largest El Nino of the solar cycle occurs and lasts till solar maximum that is frequently associated with La Nina cooling.

In figures 8-11 the evolution of the pressure differential between 1997 and 2000 (Cylce 23) is compared with its evolution between the years 2009-2011 (Cycle 24). For reference the average annual cycle in the pressure differential (figure 6) is represented by the black line.

Figure 8 Daily pressure differential. Tahiti less Darwin. hPa

The first and largest El Nino of solar cycle 23 began in early 1997. The first El Nino in Cycle 24 started in late 2009. The pattern of the differential is shown in figure 8. Plainly, the collapse in the pressure differential was more severe  in 1997 than it was in 2009.

Figure 9 Daily pressure differential. Tahiti less Darwin. hPa

The collapse in the differential persisted till March in 2010 and May in 1998. A strong recovery followed.

Figure 10 Daily pressure differential. Tahiti less Darwin. hPa

In 1999 and 2011 we see a strong pressure differential (La Nina) in the early part of the year, and in the case of 1999 this enhanced differential persisted through to the end of the year. The differential in early 2011 was much stronger than it had been in 1999.

It is noticeable that week to week variability is enhanced in 2011. I suggest that this relates to increased plasma density in an atmosphere due to reduced ionizing short wave radiation in solar cycle 24 by comparison with 23. Under these circumstances El Nino and La Nina produce a relatively ‘wild ride’.

We note the extension of La Nina into a second year.

Figure 11 Daily pressure differential. Tahiti less Darwin. hPa

2000 was a La Nina year coinciding with solar maximum. A coincidence of La Nina with solar maximum is more usual than not. On that basis one expects the current La Nina to continue into 2012. However, given the relative deficiency in short wave ionizing radiation in cycle 24 with respect to cycle 23 this time around could be different. The lack of a well-defined peak in cycle 24 will make a difference. If the cycle goes in fits and starts, so too will the ENSO experience.

Is the climate swinging towards El Nino as it warms?

It is a favorite meme of those who suggest that the globe is warming ‘due to change in trace gas composition’ that the climate is likely to become El Nino dominant.  Does recent history support this assertion? Is a warming globe associated with increased incidence of El Nino?

Figure 12 Average daily pressure differential Tahiti less Darwin hPa

In the six year period 1992-1997 the average daily pressure differential reveals an El Nino bias in relation to average for the entire period 1992-2011. In this period the globe warmed, but the degree of warming was subdued by the eruption of Pinatub0 in 1991.

Figure 12 Average daily pressure differential Tahiti less Darwin hPa

A cooling bias is evident over the last seven years from 2005 through to 2011.

Figure 13 Average daily pressure differential. Tahiti less Darwin. hPa

Plainly there has been a progression away from an El Nino towards a La Nina state over the twenty years since 1992. In the period to 1998 the globe plainly warmed. In the period since 1998 warming seems to have ceased. There has been a suggestion that some heat that ‘should be there’ has gone missing. Can this be read as an admission that warming has either slowed or has actually ceased?

Conclusion:

ENSO is not climate neutral. ENSO is the reality of climate change in action. The progression towards cooling that is evident in the increasing pressure differential between Tahiti and Darwin shows no sign of abating. The ENSO state changes not only on an inter-annual time scale but on very much longer time scales. ENSO is plainly not ‘climate neutral’.

If we look back at figure 1 we will see that the Southern Oscillation Index leads the change in tropical sea surface temperature on the upswing and the downswing. The SOI is more positive (cooling) in 2011 than it has been at any time over the last sixty years.

Until the IPCC can properly account for ENSO cycles they can not ascribe climate change to ‘change in trace gas composition due to the works of man’. We see an excellent correlation between surface pressure and surface temperature and no correlation at all between trace gas concentration and surface temperature.

Where is Science?

Posted by: erl happ | September 19, 2011

Climate disaster: declining rainfall, rising sea levels

The subject of this post is climate change in the place where I live. The climate has changed in the last sixty years and there is a widespread notion that man is at fault. It’s on the edge of a big desert. Much of the land is salty and the clearing of native vegetation has brought more salt to the surface. There is less rain. Looks like desertification is in process. Many well meaning people point the finger at farmers and we have a ban on the clearing of further native vegetation and a very active forest preservation movement.

In a report at: http://insciences.org/article.php?article_id=8586 we have a description of a paper published in the Journal of Climate, May 2010.

“CSIRO statistician Dr Yun Li and climate physicists Professor Jianping Li and Juan Feng from the Chinese Academy of Sciences remark that since the mid-1970s south-west Western Australia has seen a 15-20 per cent decrease in average winter rainfall, from 323 mm in 1925-1976 to 276 mm from 1976-2003.

South-west WA – a vast area which includes Perth, the Margaret River wine region and the West Australian wheat belt – receives most of its annual rainfall during winter from passing cold fronts and storms. However, since the mid-1970s, the number of storms in the region have decreased leading to less rainfall with the drier conditions being exacerbated due to more high pressure systems entering the area.

Modelling suggests a decrease in mean annual rainfall of 7 per cent and a 14 per cent reduction in surface water runoff in the period 2021 to 2050 relative to the period 1961 to 1990. If current climate trends continue, south-west WA will potentially experience 80 per cent more drought-months by 2070.”

The alarm has also been sounded in relation to sea levels. The increase in sea level on the west coast has been 8 mm per year, about four times that on the east coast. See: http://www.watoday.com.au/environment/sea-levels-could-rise-a-metre-by-2100-20110523-1ezf0.html

Is this just a case of what Leif Svalgaard calls ‘confirmation bias’, namely that ‘you misconstrue to see what you wish’. Is the Commonwealth Scientific and Industrial Research Organization simply projecting on the basis of past experience and a misunderstanding of the science? Is this what is to be expected from a research organization (CSIRO, NASA) funded out of the public purse? Is the notion that this part of the globe is on the way to perdition supportable?

Analysis

The past can be a guide to the future if it informs us as to how the system works. The analysis that follows is based upon observation of historical change. Secondly it is based on an understanding of the elementary laws of gas behavior. Thirdly it is informed by farmers perception that form usually follows function.

All data from http://www.esrl.noaa.gov/psd/cgi-bin/data/timeseries/timeseries1.pl

A full screen version of each figure can be seen by simply clicking on that figure.

Figure 1 Sea level pressure by latitude in 1948-57 and 2001-2010. Mb

Since 1948 the global atmosphere has shifted north.

Figure 2 Change in sea level pressure by latitude Mb.

The loss of air pressure at 60-90° south is matched by an increase elsewhere but most particularly at 30-40° south in the latitude of the winds that bring rain to the South West of Western Australia. This is where the fronts should appear. In a ‘front’ air of Antarctic origin lifts moist air of tropical origin causing rain.

Figure 3 Pressure differential between source and sink latitudes for the planetary winds Mb.

The loss of pressure at 60-70° south and the gain at 30-40° south enhances the pressure differential driving the westerly winds with the effect of:

· Enhancing the flow of the circumpolar current, driving water northwards along the western coasts of the southern continents and raising sea levels as it does so and indeed across the global ocean to the north. Sea level falls in the Southern Ocean, the largest expanse of ocean world-wide.

· Reducing the northward penetration of the polar lows that form on the margins of Antarctica that are responsible for frontal rainfall as they meet humid tropical air traveling southwards.

Figure 4

Figure 4 shows the temperature at 10hPa in the polar stratosphere over Antarctica. A dramatic stepwise increase in the winter minimum temperature occurred in 1976-79. Mid 1976 marks the transition from the weak solar cycle 20 to the very active cycle 21. A coincidence?

Figure 5 Change in surface pressure and 10hPa temperature in the region of the southern annular mode of inter-annual climate variation driven by the coupled circulation of stratosphere and troposphere over Antarctica.

The loss of atmospheric mass over Antarctica is documented in Figure 6. In Figure 5 it is seen to be associated with a rise in the temperature of the upper stratosphere all year round but particularly between June and March. It is in July and August that the most severe pressure loss is recorded. These are peak months for winter rainfall in Western Australia.

 Figure 6 Relationship between sea level pressure near Antarctica and in the Indian Ocean to the south west of Western Australia

We see that the episodic loss of atmospheric pressure at 60-70° south is associated with an increase in atmospheric pressure in the Indian Ocean to the south east of Western Australia.

The bigger picture: ENSO

At latitude 60-70° south, ozone is driven into the troposphere by the coupled circulation of the stratosphere and the troposphere over Antarctica. The pattern of pressure anomalies is described as the Southern Annular Mode (SAM) and can be tracked using the Antarctic Oscillation Index (AOI). This phenomenon lies behind the change evident in figures 1 and 2. Notice the decline in Antarctic pressure evident in the brown line in figure 6. The loss of atmospheric pressure over Antarctica relates directly to temperature change in the stratosphere. If the temperature of the upper stratosphere increases it is because there is more ozone in circulation. In consequence atmospheric pressure must fall at 60-70° south.

There is a circularity in the phenomenon. Temperature changes in the stratosphere primarily in response to a change in pressure affecting the rate of feed of NOx from the mesosphere via the night jet. So, a change in pressure raises ozone levels, pressure falls further as the atmosphere warms in response to the presence of ozone, so the night jet is affected and ozone levels increase again, so pressure must fall at 60-70°south. The circulation is so strong and persistent that it produces the lowest atmospheric pressures seen on the entire planet and acts like a bellows shifting the atmosphere to and from Antarctica and indeed all latitudes south of 50° south.

It is plain that the increase in sea level atmospheric pressure in the region to the south and west of Western Australia is due to atmospheric processes causing pressure loss in Antarctica. Loss off pressure indicates a shift in atmospheric mass. The latitude 30-40°south gains atmospheric mass as part of this process.

Figure 7 Southern Oscillation index and sea level pressure in the Indian Ocean to the south-west of Western Australia

In figure 7 we see an interesting relationship between the Southern Oscillation Index (inverted) and sea level pressure to the south-west of Western Australia. Now, remember that the SOI records the changing relationship between surface pressure in a couple of small towns in the Pacific. This change in pressure relations happens to coincide with the warming and cooling of the Pacific and the tropics generally. This is like the canary in the coal mine. The pressure change here represents a sample, and a very tiny sample at that, of the state of the global atmosphere. The SOI is really a relic of 19th Century climate science. I don’t mean to slight Mr Walker, we actually need more like him. He was a big picture man working with very little data.

Notice the stepwise increase in the SOI after 1978, plainly associated with the stepwise increase in stratospheric temperature in Antarctica. Observe the slow recovery in the SOI over the next forty years. In 2011 the SOI has set a new peak (a trough in this graph because the SOI is inverted) in relation to the entire record since 1948. This is La Nina territory. Plainly sea level pressure off Western Australia is due for a fall. When it falls, rainfall will recover and sea level will decline.

Thinking Thinking

This post shows a strong link between Antarctic surface pressure, the ENSO phenomenon, Western Australia rainfall and the level of the sea in relation to the land.

If we are to understand these phenomena we must understand the drivers of Antarctic surface pressure. There is nothing internal to the climate system that can account for what appears to be a 120 year swing in Antarctic surface pressure and the strength of the Westerly winds in the southern hemisphere. As I have illustrated at: http://wattsupwiththat.com/2011/08/20/the-character-of-climate-change-part-3/ cloud cover and sea surface temperature is driven by changes in surface pressure at 60-70° south latitude. Leif Svalgaard tells me that this is a well understood phenomenon. Strangely, I have never seen it explained in print. Perhaps he misconstrued what I was saying. It happens.

If you want to find the place where the stone falls into the water, look for the splash. Examine the ripples spreading out from that point. In the climate pond the biggest splash is in Antarctica. Look again at figure 1 and figure 8 below.

Figure 8 Temperature in the Antarctic stratosphere at 80-90°south

Where in Antarctica is the biggest splash and the associated ripples? The biggest splash is at the top of the stratosphere where the night jet introduces oxides of nitrogen from the mesosphere. Why do the ripples exhibit a less spiky, more organic form at the bottom of the stratosphere than at the top? It’s because of the influence of the coupled circulation that modulates ozone and temperature. It has least influence at the top of the stratosphere where the night jet rules supreme.

Now just in case you have been told that heating of the stratosphere is associated with ‘Planetary Waves’ or ‘tropical convection’ that might be considered to be internal to the system, consider figure 8 but also 9 and 10, the latter showing monthly temperature anomalies as a departure from the 1948-2011 average.

Figure 9 Monthly anomalies at various pressure levels in the Antarctic Stratosphere at 80-90°S 2008-2011

Figure 10 Monthly anomalies at various pressure levels in the Antarctic stratosphere at 80-90°S in 1948-50

It is plain that the temperature of the stratosphere changes first and to the greatest extent at the highest altitude and that change propagates downward. It also appears that temperature at 10hPa tends to jump in November as the Arctic circulation cuts in, the cooling of the Arctic atmosphere and the warming of the Antarctic atmosphere robbing Antarctica of atmospheric mass. The atmosphere is one big pond. The Antarctic represents the strongest circulation. In general you can expect the Antarctic to be deterministic, but here we see the Arctic saying its piece.

And the $64,000 question? What causes the jerks in atmospheric pressure that initiate the transfer of mass from Antarctica and to a lesser extent from the Arctic? We know that the coupled circulation amplifies the process. But what starts it off? This is the question to be resolved if we are to understand and predict climate change. Who do we know that should be able to tell us about the importance of plasma and electromagnetic influences on the  location of the atmosphere?

And here is a $6 question? Why is there less ozone in the southern stratosphere than in the northern stratosphere? Is it partly because it is continually being wasted into the troposphere and attacked by oxides of nitrogen from the mesosphere? Has anyone ever suggested that?

Conclusion

To take this post back to where it started, we can say that the decline in rainfall and increase in sea surface temperature in the south-west of Western Australia is plainly reversible. There is no reason to imagine that the trend of the last forty years should continue.

The sky will not fall.

Posted by: erl happ | September 8, 2011

A climate change dynamic

The presumption that  ‘the science is settled’ is incorrect.

This post aims to give readers an understanding of the dynamics of the coupled circulation of the stratosphere and the troposphere at the poles that drives  surface pressure, the temperature of the troposphere, cloud cover and surface temperature. It recently appeared at Watts Up With That. Here, in the interests of clarity, it appears in slightly expanded form.

Data source: http://www.esrl.noaa.gov/psd/cgi-bin/data/timeseries/timeseries1.pl

Shifts in the atmosphere to and from Antarctica occur on daily and weekly time scales. Witness the change between the decade starting 1948 and the decade starting 2001 shown in figure 1.

Figure 1 Change in sea level pressure according to latitude mb.

The shift in the atmosphere over Antarctica that took place between 1948 and 2007 occurs in winter, spring and summer with greatest effect on temperature at 10hPa at 80-90°south latitude in August and September. Why is the effect on temperature greatest at the highest elevation? It is due to the influence of the night jet on stratospheric ozone levels via the introduction of NOx from the mesosphere. Night jet activity varies with surface pressure.

The effect on the polar atmosphere of greater ozone levels  is to invigorate the coupled circulation of the stratosphere/troposphere lowering surface pressure at 60-70°south and invigorating the westerlies.

The influx of ozone into the troposphere results in warming, reduced relative humidity and cloud. The cloud effect is carried equator-wards in a north westerly direction by the counter westerlies resulting in the characteristic V shape in sea surface temperature anomalies.

A long term decline in surface pressure in Antarctica is consistent with strong warming in the southern Hemisphere of the sort experienced between 1948 and 1978.

A fall in pressure in Antarctica enables/produces a rise in pressure in the Arctic that results in cooling. So, the southern hemisphere warms as it did between 1948 and 1978 while the northern hemisphere cools. After 1978 the habitable latitudes in the north warmed while temperature in the south remained static. See the Character of Climate Change parts 1 and 2.

Figure 2 Temperature by month at 10hPa and 80-90° south. °C

Figure 3 below shows that the temperature increase was highest at the highest altitude. Temperature peaked in 1978 and has fallen away since that time. The southern hemisphere has not warmed since 1978, a fact well documented in my post The Character of Climate Change parts 1 and 2. In UNIPCC ‘Climate Science’ the fact and the implication of these changes in the southern polar stratosphere are unrecognized.

Warming in one hemisphere while the other cools is inconsistent with the greenhouse thesis. After 1978 the northern hemisphere warmed while temperature in the more habitable latitudes of the southern hemisphere  did not change.

Figure 3  Evolution of temperature in the stratosphere at 80-90°south. Twelve month moving average. °C.

Gauging pressure change at the poles

The change in atmospheric pressure at the poles can be monitored as the Arctic Oscillation Index (AO) or the Antarctic Oscillation Index (AAO) as depicted in figure 4 and 5. Although these indices are computed as a ratio of atmospheric pressure between the poles and the high mid latitudes, most of the change in pressure occurs at the highest latitudes.

Figure 4

The right axis in figures 4 and 5 is inverted. The Arctic Oscillation Index and the Antarctic Oscillation index vary inversely with polar pressure.

Figure 5 Sea level pressure at 80-80°south and the AAO. Left axis SLP mb.

Knowing the relationship between the AO and the AAO and polar pressure is important because these indices are computed daily. The change in polar pressure is fast and if one wishes to see the dynamics in action and speculate as to the physics involved you need data at this frequency.

Dynamics in the The Polar and Equatorial  atmosphere as pressure rises and falls at the poles

The dynamics of how the high latitude atmosphere behaves is the same at both poles.It is convenient at this point to consider the Arctic.

Daily data for both the AO and the AAO can be found at:

 http://www.cpc.ncep.noaa.gov/products/precip/CWlink/daily_ao_index/aao/aao.shtml

and

 http://www.cpc.ncep.noaa.gov/products/precip/CWlink/daily_ao_index/ao.shtml

Figure 6

In figure 6 we can see that a fall in the AO (increased surface pressure) is always associated with a strong increase in the temperature of the atmosphere below 100hPa. The warming extends all the way to the surface. As air descends, the net of ozone molecules gathering long wave radiation  becomes finer. This is classic greenhouse activity but in this case we see a potent greenhouse gas from the stratosphere entering the troposphere producing localized heating of the air. The warming seems to diminish below 500hPa, perhaps because the surface at the poles is always cooler than the air above it.

The latitudinal coverage of figure 6 extends between 65° and 90°north. So figure 6 does not encompass the zone where the troposphere is particularly affected by the descent of ozone (latitude 50-60°north). This is responsible for the zone of  ‘negative velocity’ (ascending air)  in figures 8, 9 and 10 that are colored mauve through to blue. A zone of descending air colored red is located between 70 and 90° of latitude. This pattern is in conformity with the dynamic described in the last paragraph in relation to figure 6 where a low AO index (high polar pressure) is associated with warming of the air column below 100hPa as the atmospheric column descends.

Zones of descending stratospheric air at 60-70° south, while they are better spread and more continuous than in the northern hemisphere (at 50-60°north latitude) are  nevertheless discontinuous.   Figure 7 shows that the recent cooling of the stratosphere at 60-70° south and 10hPa is most evident  between the Greenwich meridian and 180° east.

Figure 7

Source: http://www.esrl.noaa.gov/psd/map/time_plot/

Figure 8

Figure 9

Figure 10

Source of figures 8,9 and10: http://ds.data.jma.go.jp/gmd/jra/atlas/eng/atlas-tope.htm

Inspection of these figures reveals that November is the transition month when coupled circulation is enhanced in the Arctic and loses strength in the Antarctic. In the Antarctic, the  lowering of the cold point from its winter altitude of about 25hPa diminishes the coupling of the stratosphere and troposphere via its effect on the strength of convection.

Comparing high with low latitude dynamics in a warming episode at the poles

From figure 11 below we discover that:

1. When the Arctic (or Antarctic) upper stratosphere warms the equatorial upper stratosphere cools. This should be expected given the thickening of the atmosphere at the equator and a slight outward movement of the zone of heaviest ionization. That we see this activity suggests a significant plasma presence in the equatorial middle and upper stratosphere.

2. Relating the timing of warming events shown in figure 11 to the date of their occurrence  in figure 6 we see that, as the upper stratosphere warms at the pole, the AO index increases, confirming a loss of surface pressure at the pole. This warming of the polar atmosphere, greater with altitude is consistent with a reduced flow of NOx from the mesosphere via a weakened night jet.

3. Going back to figure 6 we observe a cooling of the air in the lower profile as the polar upper stratosphere warms suggesting a commencement of a general uplift of the entire polar air mass. This is consistent with an increased flux of ozone into the troposphere on the margins of the night zone, a lowering of surface pressure there, cloud loss and increased surface temperature. This is the warming dynamic. Call it ‘Global Warming’ if you like but please recognize that it is reversible.

Figure 11

How much of this coupling of the stratosphere and the troposphere is maintained over summer when the cold point in the stratosphere descends? To assess this we can simply look at the pattern of geopotential height anomalies at 200hpa (upper troposphere) that are a product of the descent of ozone. We must bear in mind that no month or season can be ‘typical’ and the concept of an ‘average flow’ is inappropriate at anything less than the time scale required for the complete evolution of the phenomenon. Our records are not long enough to support such an analysis. However, flux in wind strength in the southern high latitudes, a direct consequence of pressure change at 60-70° south latitude, suggest an evolution over a period of at least 120 years.

Lastly, in figures 11 and 12 we can observe that zones of anomalous warmth in the stratosphere are of opposite sign in the upper troposphere. In the coupled circulation it is the coolest parts of the stratosphere that descend into the troposphere. That makes a lot of sense.

Figure 11

Note: The dynamic described here is arguably  ‘the’ climate change dynamic that accounts for the ‘Global Warming’ over recent time. We note in passing that it is never global and is wholly inconsistent with greenhouse theory. Warming can become cooling. Atmospheric mass will slowly return to Antarctica and as it does so the temperature of the southern stratosphere will continue to decline. Pressure will rise at 60-70° south and the westerlies and the trades will blow less strongly. Cloud will return and the surface will cool. The increase in polar pressure in the Arctic that began in the mid 1990’s will refresh the night jet and the polar easterlies producing a cooler stratosphere and much colder winters.

I have suggested elsewhere that there is nothing internal to the climate system that could drive this dynamic over a 120 year time schedule. Change in pressure is likely related to electromagnetic influences that are amplified by the coupled circulation. A fall in surface pressure begets  a further fall in surface pressure due to the effect of pressure change on the night jet.

If this dynamic is acknowledged climate science as we know it today would be turned on its head.

Posted by: erl happ | August 28, 2011

The character of climate change part 4

This post is best read after viewing parts 1, 2 and 3 that set the scene for what is described here.

I noted in parts 1 and 2 that variability in global temperature is greatest between November and March when the globe is coolest. This is related to high variability in southern summer when global cloud cover peaks. I suggested that this variability is likely related to variation in cloud cover. In part 3 I outlined a mechanism related to the coupled circulation of the stratosphere and the troposphere in the Arctic and the Antarctic that induces a variation in cloud cover and described the spatial expression of that variation.

The manner in which the planet warms is surprising. If we look hard enough, it tells us how and why it warms. The value of a good theory is that it makes explicable what we see. It is much safer therefore to look at the manner in which the planet warms, as I have done in parts 1 and 2, before theorizing.

What follows  is big picture analysis jumping from highlight to highlight.  For data I rely on Kalnay, E. and Coauthors, 1996: The NCEP/NCAR Reanalysis 40-year Project. Bull. Amer. Meteor. Soc., 77, 437-471. accessible here: http://www.esrl.noaa.gov/psd/cgi-bin/data/timeseries/timeseries1.pl.

In this article we see that:

  1. Equatorial sea surface temperature varies with equatorial sea level pressure.
  2. Equatorial sea surface pressure varies with the solar wind.
  3. In respect of anomalous behavior that is superimposed on the  seasonal cycle, the hemispheres heat alternately.
  4. The northern hemisphere suffers the widest swings in temperature but largely in winter.
  5. The evolution of temperature depends in large part upon what is happening in Antarctica.
  6. The planet tends to heat or cool most dramatically between November and March when cloud cover is most extensive.
  7. The mechanism responsible for climate variation that is described here can account for the diversity in our experience of climate change over the last sixty years and the cooling to come. It is a mechanism that allows one hemisphere to warm while the other cools.

The Sun and atmospheric pressure

The Southern Oscillation Index (SOI) tracks the ENSO phenomenon in the Pacific Ocean.  It is based on the difference in sea level pressure between Darwin Australia (12°south 131°east) and Tahiti (18°south 150° west in French Polynesia).

Daily sea level pressure for Darwin and Tahiti is available at: http://www.longpaddock.qld.gov.au/seasonalclimateoutlook/southernoscillationindex/soidatafiles/DailySOI1933-1992Base.txt

Because the record is short, the average is lumpy. It is assumed that, were the record long enough, it would be smooth. To obtain a smooth line the data has been adjusted manually. That  smooth line is shown against the actual 30 day moving average of Darwin sea level pressure for the period January 1999-July 2011 in figure 1.

Figure 1 Seasonal evolution of Darwin daily sea level pressure in mb.

An anomaly in sea level pressure is a departure from the average daily value for a selected period. In this case the period is January 1999 to July 2011.

Figure 2 charts the relationship between the daily anomaly in sea level pressure at Darwin and the Dst index which is an index of geomagnetic activity that relates to the strength of the ring current in the ionosphere.

Figure 2 Dst Index and SLP anomaly Darwin

Left axis: Daily Dst index in nanoteslas.   Source: http://wdc.kugi.kyoto-u.ac.jp/dst_realtime/201108/index.html  Note that a fall in the Dst index represents increased geomagnetic activity.

Right axis: Anomaly in daily sea level pressure at Darwin, Australia in millibars.

Note that the right axis is inverted

It is plain that Darwin sea level pressure is influenced by geomagnetic activity.

Similarly, sea level pressure in Antarctica is influenced by geomagnetic activity as we see in figure 3. There is no readily available index of daily sea level pressure in Antarctica but the Antarctic Oscillation Index (AAO) is a good substitute. It varies inversely with sea level pressure at the pole.

Figure 3 DST index and anomaly and the AAO index

Left axis: Daily Dst index in nanoteslas.

Right axis: Daily AAO index. This axis is inverted.

In figure 3 we see that as the Dst index plunges into the negative the AAO index increases in value indicating falling pressure over Antarctica.

It is apparent that under the influence of geomagnetic activity the atmosphere moves away from the Antarctica towards the equator.

The same phenomenon is demonstrated using the ap index and the AAO  in figure 4

Figure 4 AP index of geomagnetic activity and the AAO

Left axis:  Daily Ap index in nanoteslas

Right axis: Daily AAO index

The ap index and the AAO index increase together. An increase in the AAO index indicates falling atmospheric pressure at the pole. At times the relationship seems to be better than at other times. Other variables that will be described below  influence the atmospheric response to the solar wind. In particular the level of solar irradiance is important in that it governs the plasma density within the neutral atmosphere. Plasma density determines the effect on neutrals (electrically balanced particles) as plasma responds to a change in the electromagnetic field by accelerating away and bumping the neutrals along as it goes.

The data  for the year 2008 shows  the relationship during a protracted solar minimum when the atmosphere is  least inflated because solar irradiance is weak.  It can be observed that the relationship between these variables (although still imperfect) is better at solar minimum. At that time, the response of the atmosphere to the solar wind is amplified. Solar irradiance and geomagnetic activity do not vary together. Under high levels of irradiance the response of the atmosphere to geomagnetic activity is much reduced and harder to discern. At solar maximum the atmosphere can return to the pole regardless of the level of geomagnetic activity. High atmospheric pressure at the southern pole is associated with a cooling planet because night jet activity varies directly with pressure at the pole. The night jet brings nitrogen oxides into the stratosphere reducing ozone formation. This weakens the coupled circulation of the stratosphere and the troposphere resulting in rising surface pressure at 60-70° south (and over Antarctica generally), increased cloud and weakened westerly winds. This is a self reinforcing process.

Aspects of ENSO

The  anomaly in daily sea level pressure at Tahiti has been calculated in the same way as for Darwin. Figure 5 looks at the relationship between the margin between these two  pressure anomalies on the one hand and the Southern Oscillation Index on the other.

Figure 5 Tahiti less Darwin SLP compared to the SOI

Left axis Southern Oscillation Index

Right axis: Pressure anomaly in Tahiti less the anomaly in Darwin.

The difference in the sea level pressure anomaly between the Tahiti  and Darwin tracks the Southern Oscillation Index. A fall in the index relates to El Nino warming.  This is associated with a slackening of the trade winds due to a loss of the pressure differential between Tahiti and Darwin.

A slackening of the trade winds is associated with an even greater slackening of the north westerlies in the southern hemisphere.

The slackening of the north westerlies in the southern hemisphere is due to a rise in surface pressure at 60-70° south (and over Antarctica generally). This is associated with a fall in surface pressure in the Arctic ( a simple exchange of atmosphere between the hemispheres driven by change in the coupled circulation over Antarctica).

The fall in surface pressure in the Arctic is associated with an increase in the temperature of the polar stratosphere as night jet activity falls away enabling an increase in the ozone concentration of the stratosphere. Under the influence of the coupled circulation in the Arctic this affects sea surface temperature throughout the northern hemisphere but most energetically at 50-60° north. This is a winter phenomenon.

Low surface pressure in the Arctic is the expression of the warm phase of the Northern Annular Mode (also called the Arctic Oscillation) wherein the domain of the warm humid south westerlies extends to the North Pole to the exclusion of the frigid polar easterlies. Accordingly Arctic air temperature increases and the area occupied by sea ice falls away. The dominance of warm over cool episodes marked the period 1978 through to 2007. A cool mode commenced in 2007 and the northern hemisphere is currently experiencing winter temperatures not seen since the cool mode of the 1960’s and 1970’s.

The warm mode is marked by  El Nino dominance in the Pacific whereas the cool mode relates to La Nina dominance. Dominance can be assessed in terms of the length of time that the index has one sign or the other or by simply accumulating index values over time. Neither the Arctic Oscillation or ENSO is ever climate neutral.

The initiating influence in this activity is the solar wind, but the effect of the solar wind is amplified by the activity of a strengthened coupling of the stratosphere and the troposphere over Antarctica.

As will be demonstrated below, the pattern of inverse pressure relations between the hemispheres dictates how the planet warms. But first, lets look at the relationship between sea level pressure and temperature at the equator.

Figure 6  Monthly anomalies in sea level pressure at Darwin and Tahiti

Figure 6 shows that although there are times when sea level pressure anomalies in Darwin and Tahiti move in the same direction at the same time, a period of intense warming like that which occurred in early 2010 is associated with positive anomalies in sea surface pressure for Darwin and negative anomalies for Tahiti (weak trades). Conversely, the period of strong cooling that commenced in mid 2010 is associated with negative pressure anomalies in Darwin and positive anomalies in Tahiti (strong trades).

The upshot is that sea surface temperature at the equator moves directly with sea level pressure in Darwin. Since the sea surface temperature response is associated with geomagnetic activity and is a global phenomenon one would expect that Darwin pressure would move in concert with equatorial sea surface pressure around the entire globe and this is indeed the case as we see in figure 7. The range of variation in Darwin is about twice the variation in near equatorial latitudes. The Pacific is a theater of extremes. Darwin sea level pressure increases when the zone of convection moves from Indonesia to the mid Pacific during warming events.

Figure 7 Sea level pressure in Darwin compared to that at 15°north to 15° south latitude.

Left axis: Monthly anomalies in sea level pressure 15°North to 15°south latitude, mb.

Right axis: Monthly anomalies in sea level pressure at Darwin, mb

How much of the change in sea surface temperature at the equator is associated with the variation in pressure in near equatorial latitudes?

Figure 8 Anomalies in sea surface temperature (10°N-10°S) and sea level pressure (15°N-15°S)  with respect to the average for the period 1948 to July 2011

Left axis: Sea surface pressure in mb. Twelve month moving average of raw data centered on seventh month.

Right axis: Sea surface temperature in °C. Twelve month moving average of raw data centered on seventh month.

The closeness of the relationship that is seen in figure 8, and the fact that the curves start and finish together suggest that phenomena responsible for warming, that is allied with the rise and fall in sea level pressure at the equator is consistent with the change in sea surface temperature between 1948 and the present time. This is not the whole story however. In the short-term volcanic influences can influential. Notice the depression of temperature following the eruption of Pinatubo in 1991.

The relationship between surface pressure and geomagnetic activity

The relationship between the Dst index (or the ap index) of geomagnetic activity and sea level atmospheric pressure is non linear. From episode to episode other influences condition the surface pressure response. These influences could include:

Two factors modify the sea level pressure from day-to-day, month to month and year to year and these work in a bottom up fashion:

  1. Pressure changes on a daily basis with the passage of high and low pressure cells around the globe and the wetting and drying of the air.
  2. In near equatorial latitudes in the Pacific sphere sea level pressure is affected by the migration of the zone of convection between Indonesia and the central Pacific.

Conditions in the stratosphere and mesosphere are the strongest influence on the evolution of surface pressure. The shift of the atmosphere from high to mid and low latitudes that is monitored as the Arctic Oscillation and the Antarctic Oscillation index depends upon:

  1. The plasma density where plasma interacts with neutral atmospheric molecules under the influence of the changing electromagnetic field.
  2. The state of ionization of the atmosphere as it depends upon the changing incidence of very short wave radiation from the sun.
  3. The changing electromagnetic field within the solid Earth.
  4. The changing spatio-temporal expression of the Northern Annular Mode and the Southern Annular Mode. The mode results from the coupling of the stratosphere and the troposphere that introduces ozone from the stratosphere into the troposphere causing the troposphere to warm, lowering surface atmospheric pressure in a ring like pattern at 60-70°south latitude and also 50-60° north latitude. But the expression of the mode changes over time, for instance, a migration of zones of ozone descent affects the relativity of sea level pressure between New Zealand and the Pacific Ocean west of Chile. This is possibly involved in the El Nino ‘Modoki’ phenomenon.
  5. The rate of introduction of nitrogen oxides from the mesosphere into the stratosphere over the poles affects the population of free oxygen atoms capable of forming ozone, and therefore the ozone content of the polar stratosphere. This in turn bears upon the concentration of ozone in the air that descends within the coupled circulation and the strength of the surface pressure and temperature response.

The relationship between the NAM and the SAM and sea surface temperature

The northern and southern annular modes of inter-annual climate variability influence sea surface temperature. The flow of ozone towards the equator via the high altitude counter westerlies (see part 3) warms and dries the air reducing cloud cover. Accordingly a pattern of positive sea surface temperature anomalies is generated that stretches from high southern hemisphere latitudes towards the equator in a north-westerly direction and from high northern latitudes towards the equator in a south-westerly direction. This pattern of sea surface temperature anomalies can be seen to originate from zones of increased geopotential heights at 200hPa that identify the locations of ozone descent in the coupled circulation of the stratosphere and the troposphere. This is the fingerprint of climate change as it is written in sea surface temperature.

The seasonal evolution of ENSO

Figure 9 shows the evolution of sea level pressure in Darwin and Tahiti over a year.

Figure 9  The seasonal evolution of the pressure relativity between Tahiti and Darwin

Left axis:  Sea level pressure, mb.            Right axis: Difference between blue and red curves, mb

The green curve represents the difference between the red and the blue curves. It shows the pressure differential driving the trade winds between Tahiti and Darwin as it evolves in an ‘average year’. It is positive in all months, builds strongly from July onwards and peaks just after the turn of the year. The Trades are weakest in mid year.

Figure 10 Variability in the raw data pressure differential between Tahiti and Darwin since 1999, mb

Figure 10 shows that in the last decade, variability in ENSO is least in mid year and greatest at the end of the year.

So the variation in cloud cover is greatest in the midst of southern summer when the globe is coolest. It is at this time that global cloud cover peaks with three percent more cloud than in July-August. In mid year cloud cover is reduced due to the direct heating of the atmosphere by the land masses of the northern hemisphere. But at the turn of the year the northern continents are least illuminated and this cloud degrading influence, a product of the distribution of land and sea,  is minimal.

The influence of the coupled circulation of the stratosphere and the troposphere in the Arctic between November and March explains the strong variation in cloud cover and sea surface temperature between November and March. It is at this time that the Earth is closest to the sun, irradiance is most intense, global cloud cover is greatest and most susceptible to alteration.

Surface temperature is determined not by variations in solar irradiance (very small) but by variation in cloud cover (very large). Cloud cover relates directly to the influence of the coupled circulation between the stratosphere and the troposphere over the poles. The main driver of long term change is the coupled circulation over Antarctica but in terms of the short term jerks the Arctic circulation is important and by and large it is a mirror image of that in the south. It is the rise and fall in pressure in Antarctica that determines surface pressure in the Arctic. The Arctic is more influential in determining the evolution of cloud cover in part because cloud cover is maximal at the time that the coupled circulation in the Arctic is most active.

But, the influence of the Arctic is also supercharged due to the relatively high concentration of ozone in the northern stratosphere. Ozone levels are high precisely because the coupled circulation is intermittent and the night jet less active than it is over Antarctica. In fact when Arctic pressure is weak, a situation that has persisted for thirty year intervals (e.g. 1978-1997) , ozone depletion via night jet activity is rarely seen. The temperature of the northern stratosphere is then anomalously high.

When cloud cover is curtailed the surface begins to warm.  Then the land masses of both hemispheres provide a feedback by swiftly warming the atmosphere enhancing the loss of cloud cover. Add to this the fact that wind speed is generally much lower in the northern hemisphere and we can see why gyrations in sea surface temperature that are experienced in the north Pacific and north Atlantic are about twice the amplitude of those in the southern hemisphere. Increased  evaporation due to high wind speed mutes the response of surface temperature in the southern hemisphere.

Southern waters do warm as ozone is introduced to the troposphere lowering surface pressure and speeding the flow of the westerlies. But the coupled circulation is perennial in the south and stratospheric ozone levels are consequently much less than in the northern hemisphere.

When sea surface pressure is depressed in the southern hemisphere high pressure in the Arctic enhances the flow of the polar easterlies that sweep across the northern continents towards tropical latitudes. But this is largely a winter phenomenon. It is high variability in winter that marks climate in the northern hemisphere. This is most evident in the Arctic as seen here: http://ocean.dmi.dk/arctic/meant80n.uk.php

The evolution of sea surface temperature by latitude

Figure 11 The evolution of sea surface temperature at 40-55°north and 40-55° south. Anomalies with respect to the 1948-2011 average, °C.

So far as the mid latitudes are concerned, we see the sea cooling in the southern hemisphere as it warms in the northern hemisphere. Don’t be confused by the apparently consistent pattern of warming in the southern hemisphere in summer. It’s not consistent at all. Look at 2001. Similarly one notes marked warming of northern seas in winter in 2002 and 2003.  The hemispheres warm and cool alternately, a pattern that is inconsistent with the notion that a greenhouse effect is responsible for temperature change. This pattern of anomalies is an expression  of atmospheric circumstances post the climate shift of 1976-8. It represents the current expression of atmospheric balances that are always changing. There is not one climate system but many. If you don’t appreciate the change in its parameters, you can’t model the climate system.  It’s the assumptions behind the models that give them away.

It’s a system that is open to external influences.

Figure 12 The evolution of sea surface temperature at 40-55°north and 40-55° south. Anomalies with respect to the 1948-2011 average, °C.

Left axis: Northern hemisphere

Right axis: Southern hemisphere. The right axis inverted.

In figure 12 (a restatement of the data in figure 11) we see that the cooling of the southern mid latitudes, (inverted and re-scaled) has a lot of symmetry with the warming of the northern mid latitudes. Make no mistake, sea surface temperature responds to a global stimulus with mirror image effects between the northern and southern hemisphere. This must be so, because the pattern of pressure variation at all latitudes is dictated by the evolution of surface pressure over Antarctica. If pressure is falling in Antarctica it will be rising in the Arctic and vice-versa. The variation in surface pressure is directly related to the influx of ozone into the troposphere on the margins of the Arctic and the Antarctic via the coupling of the circulation of the stratosphere and troposphere that occurs at high latitudes. The strength of the coupling varies through the year. However if one takes notice of geopotential heights at 200hPa the circulation is active to some extent in influencing surface pressure and cloud cover in both hemispheres all year round.

Figure 13 Evolution of sea surface temperature between 25 and 40° of latitude, °C.

Between 25° and 40° of latitude we see the same mirror image effect of alternate advance in sea surface temperature anomalies.

Figure 14 Evolution of sea surface temperature in near equatorial waters at 10-25° latitude. °C

In subtropical latitudes the tendency for the hemispheres to warm alternately is still apparent even though these latitudes are blessed with less cloud than higher latitudes. These latitudes are a long way away from the latitudes where the coupled circulation brings ozone into the troposphere.

Figure 15  Influence of high northern latitudes on the evolution of sea surface temperature. °C

In figure 15 we see the influence of the mid latitudes of the northern hemisphere in providing the spikes in sea surface temperature that can be seen in the evolution of sea surface temperature between 50°north and 50°south latitudes. It is not just the tropics or indeed the Pacific Ocean that is responsible for the evolution of temperature where the sun shines brightest.

Summary for policy makers
The Earth system, under the influence of solar emanations, modulates the reception of solar radiation at the surface by varying the extent of reflective cloud. The solar wind initiates this process via its influence on the distribution of the atmosphere between high and low latitudes. The effect of the coupled circulation of stratosphere and troposphere over Antarctica is to amplify these variations.

The day-to-day and year to year gyrations in cloud cover are associated with what we observe as ENSO. ENSO is a complex phenomenon that arises in part from dynamics in the Pacific including a shift in the main zone of convective activity. But the evolution of ENSO is also driven by change in surface pressure that affects deep ocean upwelling. It depends upon change in pressure at high latitudes where the stratosphere can behave like an extension of the troposphere. It does so because in winter, temperature falls away with altitude in the polar atmosphere from the surface all the way to 5hPa, encompassing both the troposphere and the stratosphere. When a convectional circulation is established the coolest parts of the stratosphere descend to elevations that we think of as the domain of the troposphere. This results in what has come to be known as the Annular Modes of inter-annual climate variation, zones of lower pressure that, as they establish reinforce the coupled circulation. These ‘annular modes’ are also involved in the evolution of climate on decadal and centennial time scales via their association with change in cloud cover. It can be shown that change in sea surface temperature and sea surface pressure  in higher latitudes heralds change in the tropics.

If we were more observant we would note that gyrations in the climate are closely associated with a strong variation in the temperature in winter in the northern hemisphere. These variations are monitored as the Arctic Oscillation. This phenomenon is part of the rich texture of climate change of equal importance to ENSO.  Both are dependent on Antarctic processes.

The role of trace amounts of ozone in the troposphere is critical to an understanding of cloud dynamics. It is the change in cloud cover that results in changing surface temperature.

Current understanding of what determines the ozone content and the temperature of the stratosphere is deficient. We need to understand the role of the night jet and the coupled circulations in modulating ozone concentration and therefore stratospheric temperature.

Geomagnetic activity and surface pressure variations evolve over long periods of time according to plasma dynamics that is seldom observed and little appreciated.

The dynamic described here provides a plausible explanation for the change in surface temperature that is observed. The pattern of temperature change is complex, varying by latitude and hemisphere. The fingerprint of change is inconsistent with the notion that the increase in so-called greenhouse gases in the troposphere is responsible for change.

The important thing to note is that the change is reversible and there is nothing that man can do but adapt. The temperature of the southern stratosphere has been gradually declining since 1978.  A less active sun will see further falls in the temperature of the Antarctic stratosphere. This will gradually reverse the  erosion of atmospheric pressure in high southern latitudes that has been influential in the warming process.

When we are dealing with complex systems like climate the idea that we can project an outcome and then qualify that projection with a statement about our degree of certainty in relation to the likelihood that we are correct, is  inappropriate. Time and again we discover that our assumptions do not reflect the real world.

Those who refuse to acknowledge that their projections are inaccurate, and in any case variable from one soothsayer to the next, are not practicing science at all. They should be able to explain the variations that we see from day to day and year to year, and that includes ENSO and the Arctic Oscillation. They are in fact doing something other than ‘science’. On no account should they be suggesting that they understand the system or that their models are a source of truth.

We can not pretend that we understand the climate system unless we can explain ENSO, the Arctic Oscillation, put the Antarctic Oscillation in its context of evolving pressure relations as the Southern Annular Mode  and explain the PDO and the NAO. When that is accomplished we might ask around as to whether people think the science is settled.

When we understand what determines  the emanations from the sun we might hazard a forecast as to the weather to be expected in six months time.

Posted by: erl happ | August 23, 2011

The character of climate change part 3

Here’s a hypothetical:

Let’s imagine that we have an atmosphere of two parts.  The first 10 km of the atmosphere has no greenhouse gas.  The second 40 km has a greenhouse gas incorporated.

In the lower layer there is  water vapor and clouds that come and go according to the temperature of the air.

Let’s consider that there is an impermeable membrane over the surface preventing the interchange of moisture with the atmosphere. No precipitation of moisture from the atmosphere falls to the surface.

Now, set this planet spinning in space around a sun in such a way that the polar sections experienced permanent night for part of the year so that the entire depth of the atmosphere (both layers) within the polar night region cool down  and a gradient of ever diminishing temperature occurs all the way from the surface to the top of the atmosphere, the entire 50 kilometers.

Parts of the planet would be warm and parts would be cold. Ascent and descent of  the atmosphere is forced by these thermal differences but the ascent is usually confined to just a few kilometers in elevation.

That greenhouse gas absorbs long wave radiation from the planet. This sets up a convective circulation within the polar night that spins the greenhouse gas  rich air away from the pole towards the margins of the polar night. Remember that temperature descends all the way from the bottom to the top of the atmosphere within the polar night and this promotes convection throughout the entire profile. In fact the two layers act as a coupled circulation.

So, greenhouse gas descends into the near surface layer on  the margins of the polar night that hitherto was  entirely free of greenhouse gas. This causes the air on the margins of the polar night to warm as it descends.  Surface pressure falls away in this region.

Now, if this circulation came and went, we would see clouds come and go on the margins of the polar night as the air alternatively cooled and warmed.

Now, let us imagine that there is a wind that blows from the polar night towards the equator that carries greenhouse gas towards the equator warming the air and causing cloud to disappear.

Now, let us introduce land and sea in the winter hemisphere and assume that the air on the margins of the polar night descends preferentially over the sea. We would then expect the greenhouse gas to be concentrated in the atmosphere over the sea. This would give rise to a pattern of warm and cool air, clouds in the cool zone and none in the warm zone. A cloud free path would be set up that ran from the warmer margins of the night zone towards the equator. The cloud would come and go as the circulation waxed and waned.

The lower of the two layers would show zones of warmed air like the map below.

Figure 1

And under the influence of the wind that blows towards the equator we might see a pattern of sea surface temperature like this:

Figure 2

Now, let’s imagine that there is an insidious chemical generated in the rarefied atmosphere above both layers that has an affinity for the greenhouse gas and this chemical is intermittently trickled into the top of the layer containing the greenhouse gas.   Accordingly, the greenhouse gas content of the night zone would wax and wane causing a fluctuation  in cloud and the temperature of the sea.

If we wished to know what was changing the weather and the climate we would have to look at what changes the trickle rate and what causes the polar circulation to wax and wane.

We look closely and find there is a ‘night jet’ injecting that insidious chemical into the top of the greenhouse gas containing layer. It is active when surface pressure is high.

We discover that the pressure is high when the sun is less active.

When the sun is active pressure is low and the night jet is less active, the greenhouse gas content builds up, the temperature of the column increases and the convective circulation goes into overdrive.

And the temperature of the polar stratosphere might look like this:

Figure 3

So, in this circumstance the clouds disappear and the planet warms. Does anyone recognize the origin of the great Pacific Climate Shift of 1976-8?

Posted by: erl happ | August 17, 2011

The character of climate change part 2

What is the utility of the globe to humanity at this particular point in the evolution of the Earths disparate climatic regimes? Has there been an improvement or deterioration in recent times. To answer these questions we must look at the pattern of temperature change by latitude.

The warmer latitudes of the northern hemisphere

Figure 1 The Northern Hemisphere between the equator and latitude 60° north.

Source: http://www.esrl.noaa.gov/psd/cgi-bin/data/timeseries/timeseries1.pl

Figure 1, relates to that part of the globe between the equator and 60° north where the density of human settlement is greatest. The data indicates that:

  • Both summer maxima and winter minima fell away between 1948 and 1976.
  • Summer maxima and winter minima then rose until 1998.
  • Summer maxima and winter minima have been fairly stable since the turn of the century.
  • In 2008 and 2011 winter minima are almost as cool as those experienced during the period of cooling between 1948 and 1976.
  • The January minimum exhibits much more variability than the July maximum.
  • Summer maxima are short of the 25°C optimum temperature for plant growth.
  • Cooling is evident after the eruption of Pinatubo in 1991.

The habitable part of the northern hemisphere is three degrees warmer in July than the southern hemisphere in January.  This is due to atmospheric heating and cloud loss associated with the higher ratio of land to sea in the northern hemisphere. The sea is transparent and absorbs solar radiation. The surface of the land heats quickly and returns energy to the atmosphere, warming  it and reducing cloud cover. Hence we have the paradox that the Earth as a whole is warmest when it is furthest from the sun. There can be no better illustration of the importance of cloud cover in determining surface temperature. The Earth tells us about feedback effects when the atmosphere is loaded with energy. The feedback is positive, due to the loss of cloud.

Hypothetically if the atmosphere became drier over time, cloud cover would diminish and temperature would increase. Conversely, if the atmosphere became wetter temperature would decrease. The drying of the atmosphere (reduced precipitable moisture) has been a powerful source of natural climate variation and directly contradicts the postulated wetting of the atmosphere that is built into the climate models beloved by the United Nations International Panel on Climate Change. Those who write UNIPCC reports do not let the facts stand in the way of a good story. Check out how the atmosphere dried between 1948 and 2005 at: http://www.esrl.noaa.gov/psd/cgi-bin/data/timeseries/timeseries1.pl  So, the Earth system itself tells us that the water vapour feedback effect as the atmosphere warms, is negative. The atmosphere becomes more transparent to outgoing long wave radiation, not less transparent.

The warmer latitudes of the southern hemisphere

Figure 2  The Southern hemisphere between the equator and latitude 50° south

In relation to the zone between the equator and latitude 50° south:

  • Both maximum and the minimum air temperatures increased between 1948 and 1977 and jumped to a new plateau in 1978. These latitudes of the southern hemisphere warmed at precisely the same time that the same latitudes in the northern hemisphere cooled.
  • A plateau was maintained between 1978 and 2011 as temperature in the northern hemisphere increased strongly.
  • There is a marked ‘Pinatubo’ effect after 1991, more so that in the northern hemisphere.
  • Summer maximums (January) are more variable than winter minimums.
  • Winter minima are raised and stabilized to an extent by the radiation of heat from the northern hemisphere that drives the cloud away in mid year. The atmosphere dried after 1978 and the consequent loss of cloud should have produced a warming surface. The fact that the surface temperature is stable after 1978 suggests that some other influence has been responsible for a compensatory cooling.

The years 1973, 1983, 1978 and 2010 are outliers in that summers are much warmer, peaking at 20.25°C. Let us note that even in the warmest summers, maximum temperatures are well short of that in the northern hemisphere and well short of the optimum for plant growth.  It is nonsense to suggest that the globe is becoming too warm if the global mean reflects warming in parts that are insufficiently warm. This part of the world is insufficiently warm.

This part of the southern hemisphere exhibits much more inter-annual variability than is seen in the northern hemisphere and the variability is greatest when the southern oceans face the sun in December to March. Questions arise:

  • Why did the southern hemisphere warm between 1948 and 1978 as the northern hemisphere cooled? Is this consistent with the suggestion that it is change in the atmosphere that is responsible for the temperature increase?
  • Why is there greater variability in both summer maxima and winter minima in the southern hemisphere than the northern hemisphere, particularly as this hemisphere is dominated by water which is supposed to have a moderating influence on climate? Is this not an indicator of a phenomenon that drives climate change by hemisphere rather than impacting the globe as a whole?
  • Why did the summer maximum in the southern hemisphere stabilize after 1978 as northern hemisphere temperature increased?
  • Should we really be concerned at this rise in temperature in the southern hemisphere when the current temperature regime is sub optimal for plant growth?
  • How valid is the global mean as a metric of planetary welfare if it is inflated by a rise in temperature of a location that is insufficiently warm?
  • Should we not congratulate ourselves on our good fortune that the southern hemisphere is slightly warmer today than it has been in the recent past rather than beat our breast in anguish?

Since the late 1970’s the habitable latitudes of the southern hemisphere have made little contribution to the advance in global temperature. The question arises: if greenhouse gases of anthropogenic origin are responsible for the increase in the global mean that is evident after 1978, why is it that we see little or no advance in either maxima or minima in the vast bulk of the southern hemisphere? Can we eliminate the greenhouse theory as irrelevant on the basis of this information?

Why is it considered that the globe is in danger of becoming too warm? Our interest is in ensuring that the capacity of the planet to support life in all its forms is not impaired.  In the warmest parts of the globe, the parts considered thus far, temperature is sub optimal for plant growth and particularly so in the  southern hemisphere. All life depends upon plants. We would be better off if the planet were warmer. It is further cooling that represents a threat to human welfare. We have plenty of scope on the upside.

Let’s put these highly pertinent questions aside for the moment and look at the climate of the rest of the globe.

In high latitudes the thermal regime is either seasonally or perennially cold. I am sure that most will agree that climate pole-wards of 60° in both hemispheres is inhospitable to man. These regions contribute to the global average temperature. But it is already apparent that the ‘global average’ is a statistic more suitable for posturing and propaganda than practical decision-making. I don’t think we will ever persuade the people of Scandinavia, Siberia or Alaska that winter cold is a good thing.

One has to congratulate the proponents of the AGW cause on their tactics, if not their science. Concentrating on the global mean is a good debating technique. They have won over the parroting media and the coffee shop ‘intelligentsia’. They have the universities stacked with ecologists and environmentalists. They have well funded bureaucracies acting as environmental policemen. Local governments are obsessed with rising sea levels, sustainability and preserving the bush. But, can the environmental movement live with its conscience when the grand theme of anthropogenic climate change is so patently flawed? Is there a conscience?

The Arctic

Figure 3 The northern hemisphere north of latitude 60° north.

North of 60° north, a region conveniently described as the ‘Arctic’, we see relatively large swings in temperature over time, concealed in this graph by the expanded scale due to the large annual range. However, the summer maximum is remarkably invariable. Winter minima are highly variable and have been rising over the entire period of record. Plainly climate change effects the minimum temperature with little change in the summer maximum. But anthropogenic influences are not capable of distinguishing between summer and winter. It must be some other factor that is causing change.

Despite the increase in winter temperatures there is little prospect that this area will be favorable for human settlement at any time in the near future. Temperatures between 10°C and minus 20°C are seriously cold. Those few who live in this part of the world will no doubt be pleased about the reduced incidence of extreme cold in winter and the very slightly longer period of temperatures favorable to plant growth that are available on the southern margins of the zone, the reduced incidence of ice on their roads and snow on the roof.

In terms of productivity, and sustainability, the variation in temperature north of latitude 60° north should be of little interest to us, particularly when the mean is simply responding to change in the winter minimum when nights are long, bears must hibernate and self respecting Eskimos are holed up in their igloos. But, perhaps this is just an ill informed Australian perspective. Perhaps the Finns actually enjoy their long winter nights, warm saunas, running naked in the snow while birching each other under the stimulating influence of vodka? This could be fun, but perhaps for a shorter interval, not the entire winter.

The Antarctic

Figure 4 The Southern Hemisphere south of latitude 60° south.

South of latitude 60°south, summer maxima are well into the freezing range and have declined over the entire period ensuring that ice is never in danger of melting. But there has been a strong increase in winter minima since 1970 that is presumably much appreciated by male penguins that stand together resolutely keeping their eggs warm. The wind chill factor is aggressive. Three million square miles of ocean freezes on the margins of Antarctica in winter and despite the increase in the winter minimum the area of ice is increasing.

The mean temperature in Antarctica has increased despite the strong fall in summer maxima. With summer maxima currently at minus 5°C and winter minima at minus 25°C this part of the world is for hardy explorers with too many fingers and toes. It is a place for research rather than habitation.

The strong increase in the ‘mean’ temperature in the Antarctic contributes to the rise in the global average. Again, we must ask just how appropriate this ‘global average’ really is. If we are truly concerned with planetary welfare, the gross product available for consumption by human and other species, the area of the globe capable of supporting habitation, personal comfort and the supply of vodka, what happens in this part of the world should be of little concern, unless the ice were to melt and there is no chance of that happening. Despite the increase in the winter minimum temperature the Antarctic ice pack is still as large as Antarctica itself, and growing.

Drawing the threads together

Firstly, let’s acknowledge that the idea that the earth is in danger of overheating is nonsense. Our planet would be more habitable if it were several degrees warmer.

Secondly we must ask whether the pattern of temperature change that we observe can be explained by the greenhouse thesis. The answer must be in the negative. If we seek to explain change in temperature we must look for a mechanism that affects temperature between November and March to account for the variability that is evident at that time. In addition we must explain the strong variation in winter minimum temperature at high latitudes.

We don’t have to look far for the cause of the variation in temperature between November and March. It’s the El Nino Southern Oscillation. Is there any agreement as to the cause of this phenomenon? No. Can we rule it out as a possible cause of climate change? Obviously not.

No ‘forcing’ like trace gas composition, that is common to the globe as a whole, and subject to the same increase regardless of season can explain the observed pattern of temperature change. Plainly, something entirely different, something that is hemispheric and seasonal rather than global in its impact, is responsible for this change. I think we will wait in vain if we expect the UNIPCC climate panel to discover the cause of the variations that we observe. These people take their cue from Lord Nelson. Look the other way. Turn a blind eye to that you do not wish to see.

But, carbon taxes and emissions trading schemes should be off the agenda. And we should forget about our ‘carbon footprint’ and the notion of ‘carbon pollution’. That is nonsense. It is about as useful as the medieval notion that climatic misfortune is due to witchcraft and bad behavior. Personally, I  earnestly hope that the writing of this piece does not result in the burning of the author at the stake.

Older Posts »

Categories