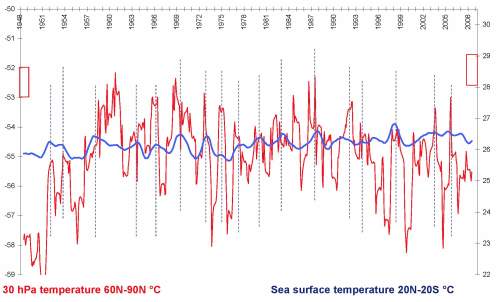
- The tropical sea warms at the same time as the air is strongly heated in the Arctic stratosphere
Strong warming occurs in the middle of the Arctic night. At the same time, the stratosphere cools over the equator and the ocean warms in mid latitudes in the summer hemisphere. El Nino shows his face. The sun, interacting with the upper atmosphere, tips the balance. The Earth warms.
Is there a systematic shift of the atmosphere when the solar wind increases? Yes. Does this affect the temperature of the surface of the Earth? Yes. Very much? Yes. Enough to account for recent change? Yes. Will the Earth cool? Yes. Will humankind be better off as a result? No.
That’s the short answer.
The route for the long answer is circuitous and the story takes a deal of telling. It involves a re-interpretation of what has been observed and the rooting out of dogma that has no justification in terms of what we experience. The reward is an understanding that carbon dioxide is not the problem that the U.N.I.P.C.C. tells us it is. It is a raw material that exists in trace amounts because it is avidly consumed by plants. Plants use carbon to produce carbohydrate that fuels construction and growth. Plants get by with less water when there is more carbon dioxide in the air. They are CO2 starved and become more productive when carbon dioxide is greatly supplemented, as is the practice in commercial greenhouse culture. A carbon rich world will be a richer in plant foodstuffs and raw materials, more capable of supporting life in all its rich diversity.
The structure of the atmosphere
The troposphere (tropos = turning) lies between the surface and about 10km in mid latitudes. Atmospheric pressure is measured in hectapascals or millibars and serves as an indication of height above the surface. 1hPa = 1mb. The pressure at the surface is close to 1000hPa. At the top of the troposphere the pressure is 100hPa (10km). At the top of the stratosphere the pressure is 1hPa (50km).
At the top of the troposphere the temperature of the air falls to minus 85°C at the equator and about minus 56°C at mid latitudes. The troposphere holds 75% of the mass of the atmosphere. At just 10km in thickness it is a very thin skin, in constant movement, transferring heat away from the Earth as cold dense air rushes in to displace light, warm air. The speed of this uplift, called ‘convection’, is assisted by the way the air rapidly thins and gets much colder with elevation. Rising gas cools via loss of pressure, the same principle that is used in refrigeration. It does not need to radiate energy in order to cool down.
The troposphere traps water close to the surface of the Earth because it gets very cold at just 3km in elevation. Most cloud is below 2km where it exists as droplets of liquid. But some exists all the way up into the stratosphere, particularly in the tropics and it takes the form of multi-branching crystals of ice that reflect of the suns rays. But for cloud, the Earth would be much warmer than it is.
The ocean stores warmth. The tropical atmosphere vents it. In the subtropics and at the poles the air descends, warming via compression as the weight of air above it increases. In this way some heat is transferred from the tropics to cooler latitudes by the atmosphere itself. At the poles in winter the air, cold as it is at minus 50°C to minus 85°C, is warmer than the surface.
The defining character of the stratosphere (stratus = spreading out) is the fact that temperatures increase with elevation. This slows convection. However this part of the atmosphere is no less turbulent in the character of its winds because it is heated unequally like the surface of the Earth. Counter to intuition, within the stratosphere, temperature increases between the equator and the pole (as does the ozone concentration), the direct opposite of the surface. In the stratosphere the oxygen molecule (O2) is split by ultraviolet light liberating heat. Ozone (O3) exists in a state of unsteady equilibrium that depends upon the balance between creation, destruction by UV light, reformation and also the erosion by water and other antagonistic substances. Once present, at a concentration of just2 to 8 parts per million, ozone interacts with UVB from the sun and infrared emanating from the Earth to produce more heat which it offloads to nitrogen, oxygen and argon that together constitute 99.96% of the mass of the atmosphere. The stratosphere in mid latitudes lies between 10km and 50km in elevation. At the upper limit of the stratosphere the temperature of the air is similar to that at the surface of the Earth. The stratosphere ends where temperature stops increasing with elevation. This is the start of the mesosphere.
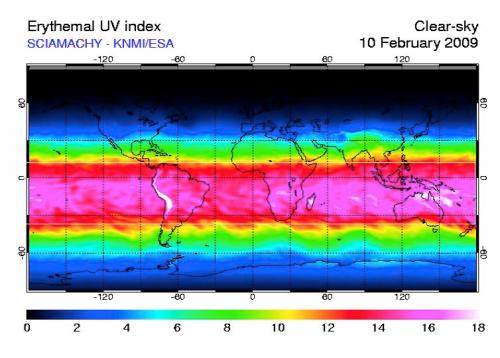
In the mesosphere and the thermosphere the energy from the sun creates a state of ionization where molecules and atoms are electrically unbalanced. The particles produced carry a charge and interact with energetic particles coming from the sun that are also electrically unbalanced. We call these solar particles the ‘solar wind’. In this ‘plasma sphere’ the laws that drive the behaviour of gases in the ‘neutral atmosphere’ are not as influential. Particles align with magnetic field lines and can be accelerated away according to the laws of electromagnetism. When ions move, they carry ‘neutrals’ with them. This affects the density and distribution of the outer atmosphere and therefore the degree of penetration of extremely short wave and highly energetic radiation from the sun. This radiation is almost completely exhausted in heating the atmosphere but some actually reaches the surface. We measure it by means as the “Erythermal UV Index” because it directly penetrates our skin causing it to blister and burn. Viewed in the ultravioletet from space, the upper atmosphere of the Earth is shifting about all the time just like flame coming off a fire.
We need to understand the stratosphere, the mesosphere and the ionosphere if we want to understand surface weather and climate because it is here that the sun interacts most strongly with the atmosphere. Just because we give names, there is no glass barrier separating these zones. The transition regions possess the properties of two or more zones because the population is polyglot. Beneath the tropopause radiation from the sun directly heats the air as it does in the stratosphere. Bodies of descending air carry ozone into the troposphere. Similarly, below the stratopause, ozone is an electrically unbalanced particle just as it is in the mesosphere. Neutrals reside in the mesosphere in the same whole and balanced electrical state that they exhibit at the surface. The atmosphere is multicultural.
The sudden stratospheric warming in the Arctic, January 2009
For a pictorial overview of the structure of a polar vortex and its interaction with the surrounding atmosphere see:
http://www.jhu.edu/~dwaugh1/gallery_stratosphere.html
The temperature of the atmosphere between the surface and the top of the stratosphere is shown in Figures 1 and 2. Figure 1 shows the Arctic and Figure 2 the equatorial region.
Figure 1 shows the sudden stratospheric warming in the Arctic that commenced 11th January 2009.
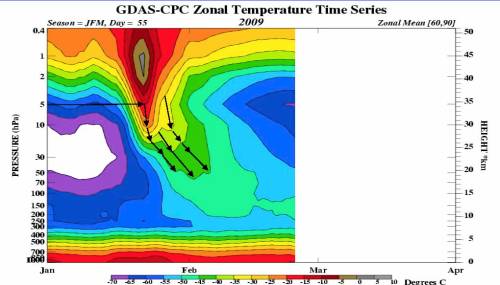
- Figure 1 Vertical distribution of temperature 65-90°North
Figure 2 shows cooling in the stratosphere above the equator that occurred at exactly the same time. This is of great interest because it coincided with warming of parts of the ocean.
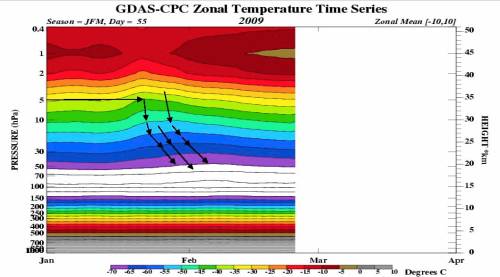
- Figure 2. Vertical distribution of temperature 10°N to 10°S
Source: http://www.cpc.ncep.noaa.gov/products/stratosphere/strat-trop/
|
Sudden Stratospheric Warming 60-90N |
Stratospheric Cooling 25N to 25S | ||||||
|
Pressure mb |
start date |
days to max |
Rise °C |
Pressure mb |
start date |
days to min |
Fall °C |
|
1 |
11-Jan |
11 |
30 |
1 |
10-Jan |
10 |
6 |
|
2 |
11-Jan |
11 |
46 |
2 |
10-Jan |
10 |
10 |
|
5 |
11-Jan |
11 |
62 |
5 |
10-Jan |
18 |
9 |
|
10 |
11-Jan |
11 |
55 |
10 |
10-Jan |
25 |
6 |
|
30 |
9-Jan |
29 |
38 |
30 |
10-Jan |
25 |
5 |
|
50 |
8-Jan |
24 |
33 |
50 |
11-Jan |
25 |
4 |
|
70 |
8-Jan |
25 |
28 |
70 |
12-Jan |
25 |
3.3 |
The dynamics behind the stratospheric warming event can be followed via an animation at http://earthobservatory.nasa.gov/images/imagerecords/36000/36972/npole_gmao_200901-02.mov
Here is my interpretation of what is happens: An increase in the solar wind occurs as a coronal hole appears on the surface of the sun in an Earth facing position accelerating the solar wind. The atmosphere inflates over the equator and is sucked back from the polar regions, in particular the night pole which faces away from the sun. This enhances the penetration of short wave radiation into the ozone rich stratosphere of the winter hemisphere causing it to warm. The density loss consequent on coronal hole activity reduces the supply of air feeding the polar night jet (the Arctic vortex). The vortex carries within it compounds from the mesosphere that erode ozone. As the vortex is weakened the ozone content of the stratosphere at high latitudes in the winter hemisphere dramatically increases. If the vortex is sufficiently weakened this warm air takes over its home, flooding into the night zone.
Change begins in the lower stratosphere in the Arctic at 70hPa on the 8th. It starts in the upper stratosphere at the equator about January 10th and in the Arctic stratosphere January 11th. The most intense change starts at the highest levels of the stratosphere working its way gradually downwards. This I believe reflects a gradual erosion of the width of the vortex at the highest altitude where solar radiation is most intense. As this happens the ocean starts to warm because a warming upper troposphere loses ice cloud.
An idea of the mechanism that is involved can be gleaned from the abstract of a very recent paper:
Crowley, G., A. Reynolds, J. P. Thayer, J. Lei, L. J. Paxton, A. B. Christensen, Y. Zhang, R. R. Meier, and D. J. Strickland (2008), Periodic modulations in thermospheric composition by solar wind high speed streams, Geophys. Res. Lett., 35, L21106, doi:10.1029/2008GL035745.
ΣO/N2 ratios in the Earth’s thermosphere are measured by the Global Ultraviolet Imager (GUVI) on the TIMED satellite, and demonstrate strong 9 and 7 day oscillations in 2005 and 2006, respectively, that are well correlated with the solar wind speed and Kp index. This work builds on the recently discovered connection between rotating solar coronal holes and thermospheric mass density variations. The work described here is the first description of geomagnetically forced periodicities in neutral composition. Furthermore, these observations provide the first definitive proof that the processes creating neutral composition changes during geomagnetic storms occur continuously at all activity levels and all over the world. The ΣO/N2 response versus the mass density response indicates the important role of vertical winds at high latitudes while thermal expansion dominates at lower latitudes.
My interpretation of this abstract: Under the pressure of the solar wind the mass density of the atmosphere changes. Secondly, erosive nitrogen particles are formed in the upper atmosphere in accordance with the solar wind as measured by change in the Ap index of geomagnetic activity. These particles degrade ozone at the margins of the downward stream of air called the polar vortex.
The change in mass density with the passage of coronal holes is of great interest. Does it involve a shift of the atmosphere from the poles towards the equator? That question that can be settled by observation or by inference. The cooling of the equatorial stratosphere could be a product of sudden mass transfer.
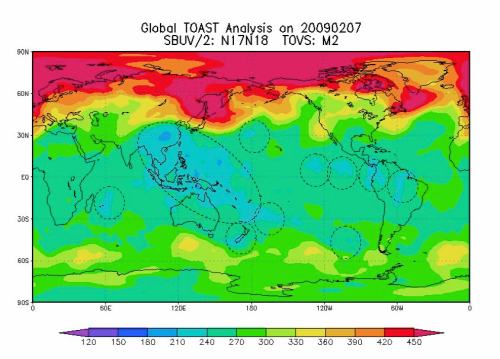
A Sudden Stratospheric Warming in the Arctic is not an unusual event for January. However the 2009 event is relatively high intensity and of long duration. The isotherms suggest two or three stimuli arriving in close succession. Study of the 30hPa heat flux and geopotential flux from Free University Berlin together with change in the stratospheric winds ( figure 3) , suggest five or more stimuli. By 1st February the stratospheric winds at 10hPa 60N are stalled. The Arctic vortex is stalled, the area where it formerly existed is loaded with ozone and ‘lit up like a Christmas tree.’ (see figure 7 below).
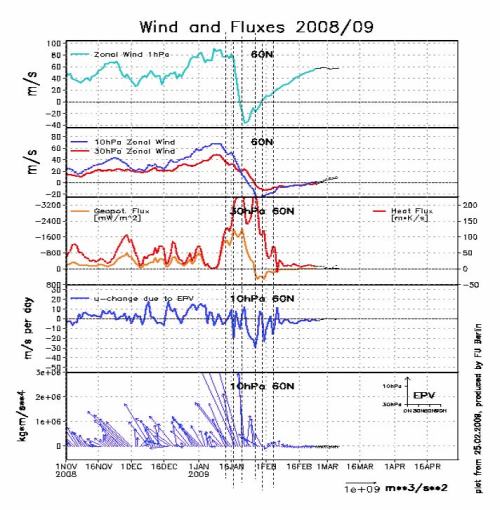
- Figure 3. Wind and Fluxes in the stratosphere.
When stratospheric warming occurs in the polar regions it is always associated with cooling of the tropical stratosphere. Occurring in conjunction with a deep solar minimum, an event of this magnitude is an observational rarity. However, it seems to be associated with La Nina conditions in the tropics because significant events occurred in 1999, 2001, 2004, 2006 and 2009. A large event of this type also occurred in the transition between solar cycle 21 and 22 in 1987. This was an odd to even number transition, a reversion of the suns magnetic orientation that usually yields a reduction in the impact of the solar wind on the Earths magnetosphere.
An interesting aspect of the warming of the sea is that it seems to be most intense outside the strict confines of the Equatorial zones. See Figure 4. The Equatorial zones are customarily monitored in the process of documenting ENSO events. This warming has nothing to do with shifting warm pools, counter currents or ‘coupled oscillations of the atmosphere and the ocean’. The increase in sea surface temperature is most intense at 20°-40°S latitude. The warming coincides with an increase in the temperature of the upper troposphere evaporating cloud and allowing more sunlight to reach the surface. The latitude affected is the source of the trades on the one hand and the westerlies on the other. It is characterised by high pressure cells that entrain ozone rich air from the stratosphere.
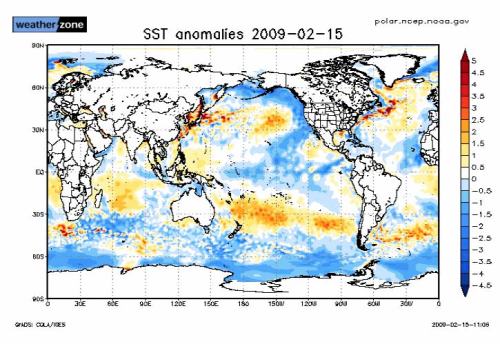
- Figure 4. Sea surface temperature anomalies February 15th 2009
Source: http://www.eldersweather.com.au/climimage.jsp?i=sstag
Cosmic rays and atmospheric density
Recent work demonstrates that there is a very close connection between cosmic ray intensity as measured at the surface (or deep under ground) and the density of the upper atmosphere. Atmospheric scientist Dr Scott Osprey and particle physicist Dr Giles Barr, both of the University of Oxford became aware that cosmic ray detectors could sense changes in atmospheric temperature.
The italicized text is drawn from a press release issued at the time of submission of their work to the journal Geophysical Research Letters.
“Cosmic rays are high-energy particles that stream into Earth’s atmosphere from space. One type of particle, the meson, is unstable and quickly decays into another, the muon.
When the atmosphere heats up, it expands, and this means fewer mesons are destroyed by hitting air molecules. This in turn means more mesons are available to decay naturally into muons, which are less likely to interact with the atmosphere and so more likely to make it to Earth and be picked up by the MINOS detector.”
The following text is drawn from the paper:
“For the first time, daily variations in secondary cosmic rays from an underground muon detector are shown to be associated with planetary–scale meteorological phenomena in the stratosphere. These phenomena occur over timescales from around ten days to two weeks and are intimately linked with the wintertime stratospheric polar vortex. The correspondence with the MINOS data is striking, especially during the winter months.
Our results raise the possibility of utilising muon detectors for meteorological applications. Other large underground detectors around the globe should find their data contain similar variability. The positive temperature effect has only previously been seen in variations averaged over seasons [Ambrosio et al., 1997]; here we have shown that much shorter term variations can be seen.
Future studies may show that the early cosmic ray data has captured useful upper-air information which is beneficial to centres such as the European Centre for Medium-Range Weather Forecasts particularly as a basis for calibrating long term trends in temperature.”
It is thought that Sudden Stratospheric Warming events are due to Rossby waves originating in the troposphere that propagate into the stratosphere, releasing energy. Here is the description of a Rossby wave from this paper:
In the atmosphere, planetary Rossby waves can have horizontal wavelengths of several thousand kilometers [Andrews et al., 1987]. These waves propagate up from the troposphere to the stratosphere during winter [Charney and Drazin, 1961] and have an association with high-latitude vortex structures in the upper atmosphere. In analogy to water waves these waves can break causing temperatures in the polar stratosphere to rise by over 50K in a few days. These events are known as Sudden Stratospheric Warmings (SSW) and appear as a displacement or splitting of a large persistent low pressure system which resides over the pole, known as the wintertime stratospheric polar vortex. These events are observed as anomalous changes in temperature and wind at high latitudes. The frequency of SSW is thought to be tied loosely to the wind direction in the tropical stratosphere [Holton and Tan, 1980] and sea-surface temperatures [Chen et al., 2003].
The distribution of the major land-masses provides a means of generating these waves, as air is pushed up as it moves over steep terrain. Consequently most recorded instances of SSW have occurred in the Northern Hemisphere where most land surface is found, with only one recorded instance in the Southern Hemisphere [Varotsos, 2002]. SSW was discovered in the early 1950s by Scherhag using radiosonde measurements.”
The nature of the vortex
The southern vortex is a well defined structure made up of a central cell of descending air travelling in an anticlockwise direction. This is a high pressure cell. It is surrounded by low pressure cells where vortex air mixes with the westerlies that originate in the large high pressure cells centred at about 35°south. The latter represent the southern limit of the Hadley cell with the northern limit residing in a wide band of low pressure cells located near the equator. Even in the warmest months of summer, the structure of the Antarctic Vortex is maintained by the descent of very cold over Antarctica. In the winter this high pressure cell is strengthened and the air reaches temperatures as low as minus 80°C. In winter all the pressure cells move north bringing rain to the Mediterranean type climates of Western Australia, South Africa and Chile.
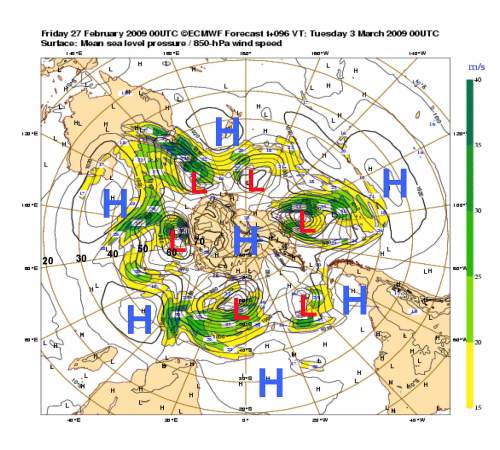
The Antarctic Vortex
The Arctic vortex is a winter only phenomenon. In early March 2009 it is absent as a result of the warming event of January. The Arctic high pressure cell is easily disturbed by the establishment of competing high pressure cells over Greenland or Siberia. The Arctic vortex does not always reach the surface, existing only in the stratosphere- upper troposphere. When it does reach the surface it sends cold winds far south into the northern continents. The absence of a continental ice dome like Antarctica and the presence of so much land in the northern hemisphere is responsible for a very different dynamic in the atmospheric flows to that which occurs in the southern hemisphere.
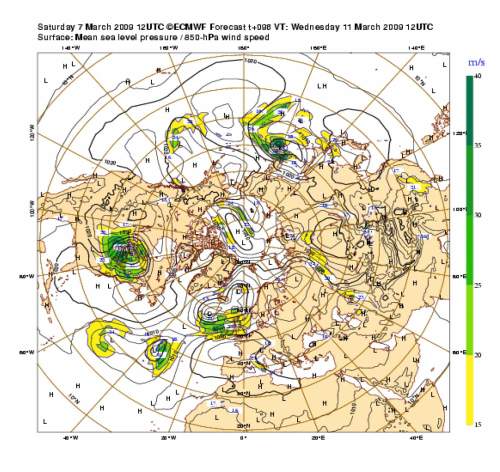
Forecast Northern Hemisphere sea level pressure and wind strength 7th March 2009
What then is the actual cause of sudden stratospheric warming?
Scherhag suggested a connection with solar activity. His successors at the Free University of Berlin have established strong links between temperature above 200hPa and solar activity. These you can investigate at:
http://strat-www.met.fu-berlin.de/products/cdrom/html/section6.html#fig31
However, linking change in the weather with solar influences, even in the stratosphere, is unfashionable. If the sun determines weather, a raft of people might be seen to be both misguided and even a burden on the public purse.
The notion of ‘atmospheric waves’ producing energy is about as plausible as the idea that an increase in the proportion of trace gas content can cause the troposphere to warm. It hasn’t, except below 700hPa (about 2km) where it is in contact with a warm ocean and most of the latent heat of evaporation is released. Both of these ideas are ‘unphysical’. If one were to take these notions on board one might then look seriously at the possibility that fairies frequent the bottom of the garden.
The variation in muon counts confirms that stratospheric warming is associated with a change in atmospheric density. This is consistent with a redistribution of the atmosphere from the pole towards the equator. That would tend to reduce the strength of the vortex. That would in turn reduce the erosive activity of vortex air on ozone. More ultraviolet light and more ozone could together produce the temperature increase observed. The cooling in the Equatorial stratosphere suggests that this is where the displaced atmosphere finds its new temporary home. Rossby waves can not change atmospheric density. The low pressure cells that are associated with the vortex elevate ozone rich air from the westerlies into the stratosphere where the increase in temperature is sudden and intense. The invasion of the Arctic by warm ozone rich air requires that the cold vortex is first cut off from its air supply.
The warming begins outside the Arctic Circle because the Arctic Circle is in darkness. Ozone content in the northern hemisphere reaches a maximum in winter when the stratosphere is coldest. The further north, the warmer is the stratosphere. Many workers have established that there is a direct relationship between ozone concentration (Dobson Units) and stratospheric temperature at high latitudes. Recent work, in particular the abstract above, confirms the dependence of stratospheric ozone upon the strength of the vortex and the concentration of erosive compounds that it brings to the lower atmosphere.
The increase in ultraviolet radiation in 2009
Figure 5 and 6 shows the marked increase in ultraviolet radiation between the equator and 30°S in 2009 over 2008. Both intensification and band widening is apparent. In January it is the subtropical high pressure cells of the southern hemisphere at 30-40°S that are most affected by the increase in ultraviolet radiation.
A recent study by Werner et al.1 has found that by the end of the winter in the northern hemisphere, vortex air makes up about 30% of the total in the lower stratosphere as far at 40° south latitude. When the vortex is diminished the effect is felt well to the south of the night zone. It does not take an increase in UV light to produce a temperature increase in these circumstances. The increase in ozone will do that.
There is a mystery here. The intensity of ultraviolet seen at the surface depends upon the ozone content of the stratosphere. The ozone content of the stratosphere increases due to the collapse of the vortex and yet we observe an increase in ultraviolet light at the surface. The reason for this could lie in a change in the suns output of very short wave radiation. Sunspot activity is currently negligible and increased only very slightly between 2008 and 2009. But 10.7 Flux began to increase about August 2008. Perhaps a slight increase in short wave radiation plays a part in setting up a more volatile plasmasphere, that will in turn facilitate an atmospheric shift. This could be a major contributor to the change in UV as registered at the surface of the Earth. In other words, the Earths natural filter is weakened by the joint action of slightly enhanced short wave energy anf the capacity of the solar wind to force an atmospheric shift.
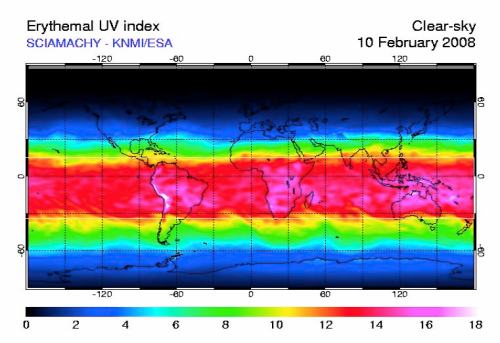
- Figure 5
- Figure 6
The factors responsible for the distribution of ozone in the stratosphere/upper troposphere.
A cooling story involving ozone, the sun and the sea describes how moisture rising from the equatorial troposphere degrades ozone. Every warming event in the tropics lowers the temperature in the tropical stratosphere. Ozone is lost to water vapor due to its marked solubility. Over a scale of days and weeks this process should lift the isotherms in the stratosphere from left to right from the tropopause upwards, the reverse of what is seen in figure 2.
The ozone depletion by water vapour can be seen in Figure 7 at the height of the stratospheric warming. The depletion areas are marked. Ozone is depleted over the maritime continent and the Amazon and other locations where uplift is strong. However, this bottom up cooling process is slower than the process that begins at the top of the tropical stratosphere and works its way down. It is not the source of the dramatic cooling at the top of the stratosphere in early 2009.
What causes the ocean to warm? The maritime continent and the Amazon are centres of strong uplift with a lot of cirrus cloud in the upper troposphere. A warming of the upper troposphere immediately reduces cirrus density and allows more light to reach the surface of the ocean. Since tropical waters are by and large temperature saturated, more energy simply drives evaporation.
- Figure 7
Source: http://www.osdpd.noaa.gov/PSB/OZONE/TOAST/index.html
Ozone is generated most strongly in the tropics where ultraviolet light is most intense. However the local moisture supply and continuous transport to the poles via the Brewer Dobson circulation in the stratosphere keeps the concentration in the tropical stratosphere quite low. At higher latitudes ozone accumulates. This is particularly so in the northern hemisphere where the Arctic vortex operates only in winter. In general a colder stratosphere favours increased ozone content because it is drier.
The stratosphere has been cooling since 1980. Some suggest that this is due to greenhouse gases trapping heat in the troposphere. This is nonsense. If sufficient energy were to be trapped in the troposphere to actually cause the stratosphere to cool, the oceans would soon begin to boil. In fact, the troposphere is not warming, the stratosphere ceased to cool about 2000 and it is now warming. The warming of the stratosphere is conjunctional with ocean cooling that began about the turn of the century.
Ocean temperature has a secondary influence upon high latitude ozone. The strength of uplift in the summer hemisphere influences the strength of the polar vortex the winter hemisphere. The increase in Arctic ozone in February with the stalling of the vortex demonstrates the extent to which the ozone content of the winter hemisphere is influenced by the descent of erosive nitrogen compounds from the mesosphere. In the southern hemisphere the vortex operates in both summer and winter with the result that ozone contents are much lower in the southern hemisphere and a ‘hole’ manifests at the end of the winter.
The change in Arctic ozone levels during the warming event is documented in figures 8 through 13. First, note the generalized slight increase in ozone prior to the commencement of the stratospheric warming event on the 11th suggesting that a process of vortex erosion is already underway before the event manifests. A large coronal hole began to increase electron density in the solar wind from January 5th. The wind takes five days to reach the Earth. The commencement of the SSW event on the 10th (Equator) and 11th (Arctic) is marked by strong ozone enhancement that is further reinforced as the event progresses.
Notice that the level of ozone in the tropics falls away (more blue and dark blue tints) but it gradually recovers towards the end of February. This is the moisture supply factor at work stimulated by warming of the tropical ocean. Ozone patterns in the subtropics on March 3d partly reflect the variation in sea surface temperature anomalies. It is the zones that experience the greatest warming that show the ozone losses in the stratosphere. One must remember that the troposphere is very thin.
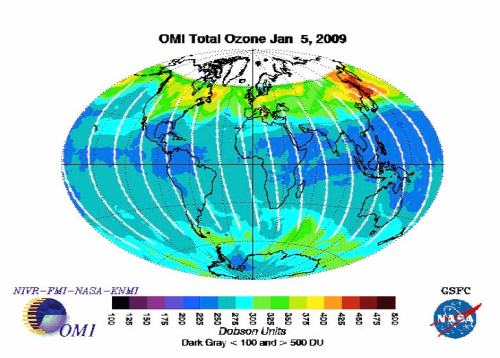
Figure 8
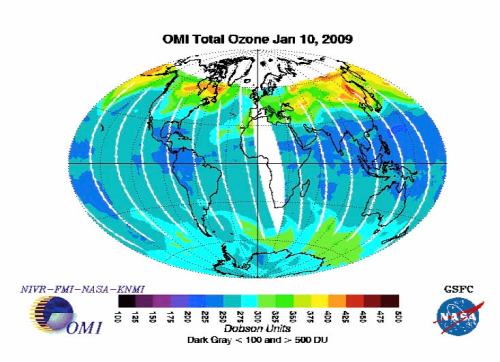
Figure 9
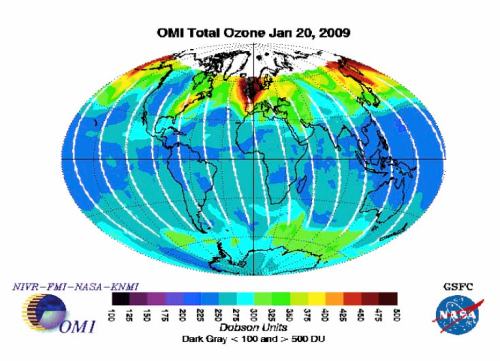
Figure 10
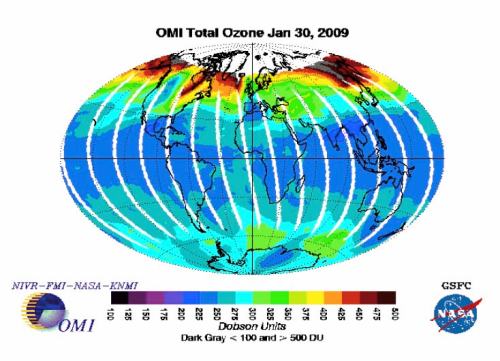
Figure 11
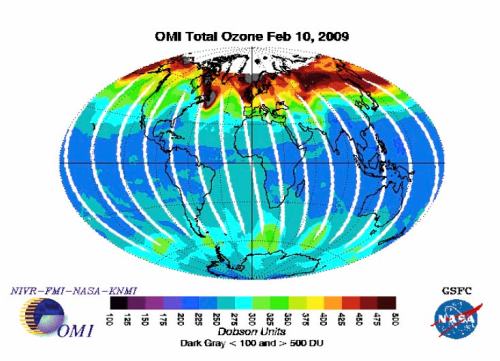
Figure 12
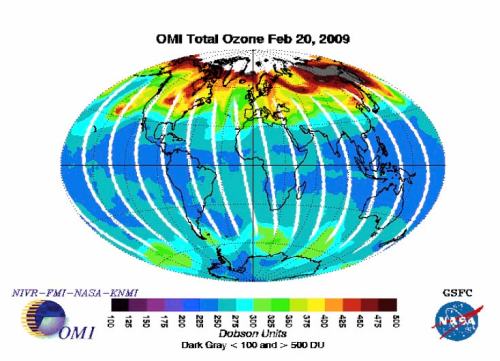
Figure 13
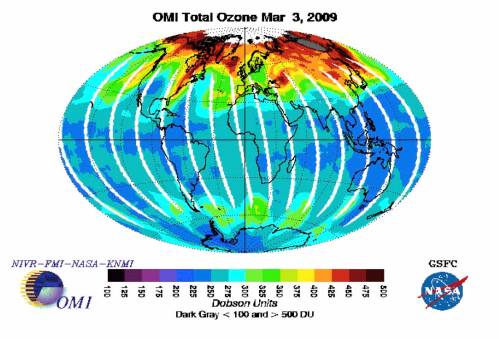
Figure 14
The course of the warming event in the Arctic
This narrative relates to figures 7 through to 14.
Let us first note some preconditions. In 2008-9 the atmosphere is very compact, the stratosphere is cool and geomagnetic and indexes lower than ever observed. Except for a brief interval in 2007 the tropical ocean has been cooling since 2006. The latter has promoted an increase in stratospheric ozone. The strength of the Arctic vortex in part depends upon uplift in the tropics which, under La Nina conditions, is minimal. The northern hemisphere is experiencing an old fashioned cold winter. In 2009 the intensity of ultraviolet light has increased as cycle 24 initiates. The ionosphere is set up to react more strongly to the solar wind.
A recurrent coronal hole on the sun appears in the Earth facing position every 27 days, ramping up the solar wind. Coronal holes influence the extent of the daytime heating of the plasmasphere/thermosphere in a fashion that depends upon the lines of the Earths magnetic latitude. An expression recently promoted by NASA is that the Earth can be seen to ‘breathe’. In other words the air is mobile. Its mobility and directionality depends upon the Earths magnetic field lines and the complexion of the solar wind. It rises more strongly near the equator. In effect the Equatorial atmosphere lifts strongly on a daily basis.
The solar wind brings about an abrupt equator-ward shift in the atmosphere causing strong cooling at the highest levels of the tropical stratosphere thereby cutting off the vortex at source. In the Arctic the cold air of the vortex is increasingly corralled by the supply of ever warmer air on its perimeter. The supply of erosive nitrogen is cut off and the ozone content of the air outside the vortex naturally increases. This adds to the heating and expansion of the air surrounding the vortex rendering the upper atmosphere convectionally unstable. Eventually the natural home of the vortex is invaded by very warm air from outside and the residual cold air is mixed in and dissipated. The Arctic night turns warm. The night jet is not in evidence. In terms of ozone the entire Arctic north of 60°N is lit up like a Christmas tree. There has been a dramatic increase in ozone content in particular locations between the Arctic pole and and 30°N.
Why do we not hear about warmings in Antarctica?
Sudden Stratospheric Warmings are rare in Antarctica because of the strength and persistence of the vortex and the resulting low ozone content of the entire southern hemisphere. This results in an excess of ultraviolet light that produces the ruddy Australian complexion and possibly accounts for the seasonal increase in suicides in Chile, in spring.
Nevertheless ozone content in the southern hemisphere builds up when the tropical ocean cools, as it did following the La Nina of 2000. Solar cycle 23 had a double peak in sunspot activity with a collapse of both sunspot and geomagnetic activity between 2000 and 2002. In mid 2002 the ozone hole over Antarctica was small. A spectacular sudden stratospheric warming was observed for the first time. An animation of this event can be seen at: http://planetearth.nerc.ac.uk/news/story.aspx?id=300
This animation is worth close study because Antarctica has a much simpler meteorological geography than the Arctic. The origin of the warming and the progress of the event are more transparent. There is no mountain range between Antarctica and Australia to promote Rossby waves. However, there is a large recurrent positive ozone anomaly between Australia and Antarctica and this is where the warming begins.
The animation clearly shows the air warming outside the Antarctic Circle, circulating around it, apparently destabilizing the cold air of the vortex that inhabits the ice dome that is Antarctica while at the time gathering mass, expanding the atmosphere and finally flooding in, taking over the home of the evaporating vortex. This warming clearly starts between 30 and 60° south latitude between Australia and Antarctica in the recurring ozone ‘hot spot’. Hot air can not undermine cold air. It moves in as the cold air vacates the space. One interpretation of what the animation shows is that the observed increase in temperature outside the vortex is entirely due to a diminution in the strength of energetic mixing as the vortex weakens. The issue to resolve is then: what causes the reduced supply of air to the vortex?
Why is warming relatively frequent in the Arctic?
In the Arctic stratosphere winter warming is very common. Why?
- Geography. The centre of coolest surface temperature in the northern hemisphere is not the pole but Siberia and Greenland. The vortex has two natural centres of activity, not one.
- The Arctic is too warm in summer to support a vortex. The vortex, even in winter is congenitally weak. Arctic temperatures are no lower than summer temperature in the Antarctic. The concept of the ‘Arctic oscillation’ registers the variable strength of the winter Arctic Vortex which is seen to promote a more northerly track for warm westerly winds in its weak phase and incursions of very cold air from the Arctic into Europe in its strong phase. This creation of this index recognizes the inherent instability of the Arctic Vortex and the resulting impact on hemispherical weather.
- There is great potential for relocation of ozone via uplift from the upper troposphere/lower stratosphere in the region over Japan, east of the Siberian winter high pressure cell where ozone content is particularly high and also in the North West Atlantic south of Greenland. The stratospheric vortex is readily split as the circulating warm air from two distinct hot spots easily divides the arc of cold air between Greenland and Siberia.
- Between November and March the Earth is closest to the sun; the Arctic atmosphere is at its coolest and is thereby richest in ozone while solar radiation is almost 7% stronger than in July. This, and the weakness of the vortex tips the balance in favour of instability.
So far we see that the presence of ozone is variable, dependent on solar wind activity and the erosive possibility of moisture uplift from the tropical oceans. It is apparent that Arctic warming episodes are dependent upon the strength of the vortex, that in turn depends upon change in the density of the atmosphere wrought by the solar wind and a possible change in the intensity of short wave radiation. Cold air always displaces warm air when present. The most sensible interpretation is that the collapse in the supply of cold air lies behind the ozone increase and the skyrocketing temperature. There is obviously a relationship between atmospheric density above the pole and the supply of air feeding the vortex.
Rossby waves, my foot.
Timing
Figure 15 shows that between November and June, temperature in the Arctic stratosphere swings wildly.
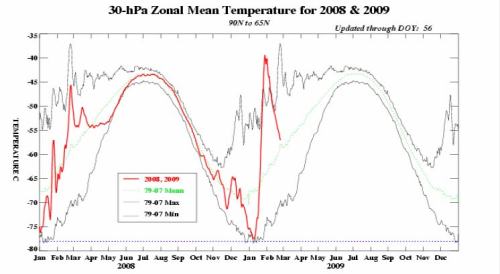
- Figure 15
Source http://www.cpc.ncep.noaa.gov/products/stratosphere/temperature/index.shtml
Figure 16 shows that the temperature in Antarctic varies much less than in the Arctic. The period of greater variation is between May and January. Hence there is an overlap in December and January when the Earth is closest to the Sun.
Note in passing that In September and October 2008 a strong increase in temperature occurred over Antarctica. This is a time when temperatures normally rise in the tropical stratosphere. As the Antarctic stratosphere warmed the tropical stratosphere cooled by 2° rather than rising by 5° which is the norm.
Notice the strange depression in temperature in the tropical stratosphere between November and April when the Earth is closest to the sun. At a time when irradiation is greatest, the highest levels of the tropical stratosphere are almost as cool as in June when irradiation is almost 7% weaker. There is no way to explain this other than a shift in the atmosphere that has the effect of weakening irradiation at the top of the tropical stratosphere.
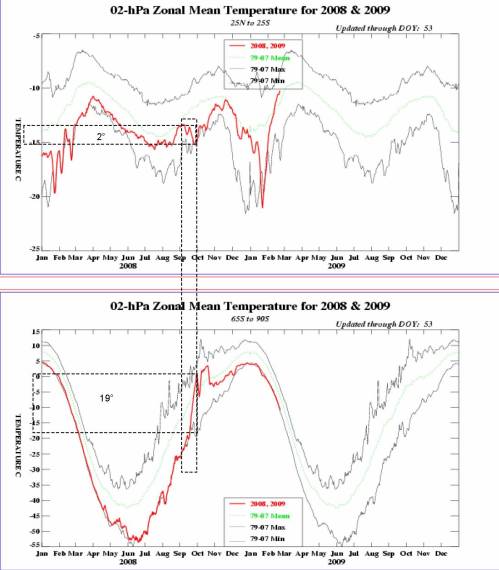
- Figure 16
Source http://www.cpc.ncep.noaa.gov/products/stratosphere/temperature/index.shtml
El Nino shows his face.
ENSO is dependent upon the concentration of ozone in the upper troposphere and the variation in the ultraviolet radiation from the sun. Sea surface warming follows the evaporation of high altitude cirrus cloud. Outside the major centres of convection this cloud is virtually invisible because it is present in only trace amounts. The increase in the temperature of the air at the upper limits of the high pressure cells in subtropical latitudes is greater than elsewhere because these cells entrain ozone from the stratosphere. These same cells give rise to the trade winds. The increase in temperature at the top of the descending column of air counteracts the tendency for the air to settle. Sea surface pressure falls and wind strength abates. The loss of trade wind velocity is the surface manifestation of ENSO.
Which hemisphere drives sea surface warming in the Pacific and the global tropics?
The variation in temperature in the eastern Pacific, at 200hPa in two locations in opposite hemispheres, is compared to see which hemisphere is the stronger driver of sea surface temperature. The first location, off the coast of California, is the home of a strong high pressure cell that is important as a source of the north east trades. In the south a similar high pressure cell off the coast of Chile is important in driving the south east trades.
The axes on these figures are adjusted so a degree Centigrade is represented by the same interval in all instances.
The variability in 200hPa temperature in these locations is much greater than the norm for the latitude. Both locations also exhibit much more variability in 200hPa temperature than is seen in surface temperature. The source of the variability is plainly ozone.
In selecting a location in the northern hemisphere, the effect of the summer heating of the northern land masses is captured. This heating of the landmasses in northern summer reduces global cloud cover by about 3% and the effect is to drive strong atmospheric warming between the equator and 30°S where sea surface temperature is at its annual minimum. Because a deficit in humidity is experienced south of the equator at this time, a disproportionate loss of cloud occurs. This factor should lend influence to the northern hemisphere.
The southern hemisphere has much more sea to absorb solar radiation which lends weight to its influence in driving tropical sea surface temperature.
Sea surface temperature in the region 20°N to 20°S is an excellent index of ENSO wrought change in global climate.
The graphs show that neither hemisphere exclusively drives tropical temperature. At times they reinforce each other and at times they act independently. One feature that stands out is the strong increase in 200hPa temperature in both hemispheres around 1978 and the slow decline since that time.
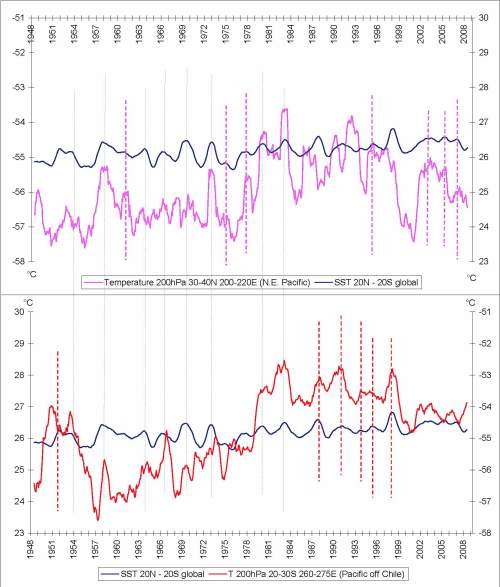
- Figure 17 Sea surface temperature and 200hPa temperature. Top is north Pacific off California, bottom is South Pacific off Chile
Figure 17 by the author. Twelve month moving average of monthly data centered on the seventh month. Data: http://www.cdc.noaa.gov/cgi-bin/data/timeseries/timeseries1.pl
The air at the surface is warmed by surface contact, release of latent heat and radiation. The air at 200hPa is warmed partly from below and partly from above. It is the warming from above that is important from the viewpoint of climate change because it drives the cloud cover that determines how much solar radiation is reflected and how much reaches the transparent and all absorbing ocean. The temperature of the upper troposphere conditions the strength of the high pressure cells, their vorticity, and the area that they occupy, the area of relatively cloud free air within the Hadley cells on either side of the inter-tropical convergence and the strength of the surface winds.
An interpretation of the relationship between the sun and the climate system within the framework of the solar cycle
Recapitulation: The solar wind promotes a displacement of the atmosphere from the poles towards the equator producing an immediate fall in temperature in the stratosphere over the equator and a rise in temperature in the stratosphere over the pole. The warming in the Arctic is the phenomenon called ‘midwinter warmings’. However, warming in Antarctica occurs also in southern winter, spring and summer.
In these polar stratospheric events warm ozone rich air is apt to temporarily displace the ozone depleted air in the home of the vortex, the polar night zone. Weakening of the vortex implies a reduction in the influx of erosive nitrogen compounds from the mesosphere. A strong increase in the ozone content of the stratosphere occurs throughout the winter hemisphere as the vortex is weakened.
In December and January the temperature of the Antarctic and the Arctic is seen to be highly volatile, the more so in the north than the south. This is associated with an increase in the temperature of the tropical ocean. It appears likely that an atmospheric shift is associated with an increase in the intensity of ultraviolet light in the subtropics of the summer hemisphere.
If the solar wind is responsible to a significant extent for variation in the ozone content of the stratosphere and upper troposphere in mid latitudes, or in the incidence of ultraviolet light, so causing an increase in the temperature of the stratosphere/upper troposphere, causing cloud loss, the temperature of the sea in the tropics should rise with the aa index of geomagnetic activity.
This possibility is explored in figure 18.
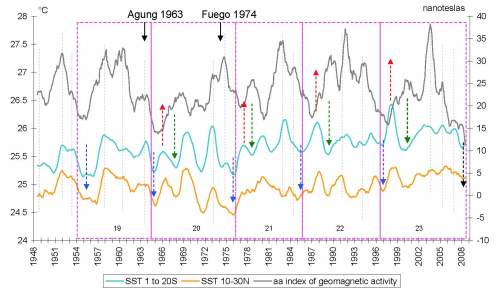
- Figure 18
Figure 18 by the author. Twelve month moving average of monthly data centered on the seventh month. Data: http://www.cdc.noaa.gov/cgi-bin/data/timeseries/timeseries1.pl
Each solar cycle is shown as a separate pink rectangle and the cycles are numbered 19 through 23.
In an effort to discriminate between the effect of the hemispheres sea surface temperature for a zone to the north and another to the south of the warmest waters in the tropics that are located between the equator and 10° north. The northern waters at 10-20°N are warmer than the band at 10-20°S.
Starting in cycle 20 the northern hemisphere experienced wider swings in sea surface temperature than the southern hemisphere. The difference between the hemispheres expanded with time. The northern hemisphere temperature increased faster. Although broadly similar, differences in the timing, and the amplitude of the peaks is apparent. The north is ore volatile.
The explanation below emphasises that there is more than one factor responsible for sea surface temperature in the tropics. These include the flux in short wave radiation, the separate flux in the solar wind and the properties of the atmosphere itself. The interrelationship between these factors is described:
- Blue arrows. A La Nina cooling event marks solar minimum. The La Nina dries the atmosphere via precipitation and renders the transition to a warming event increasingly likely the longer it continues. Because solar minimum is a low point in the generation of ionising radiation the atmosphere becomes very compact. However even relatively slight geomagnetic activity is a strong driver of atmospheric distribution and ozone content in the absence of sunspot activity. Geomagnetic activity continues to decline after the new sunspot cycle is initiated. Changes in geomagnetic activity at solar minimum are related primarily to the appearance of coronal holes in the Earth facing position. Warming events at this time are likely to be of short duration because the sun rotates on a 27 day rotation and are unlikely to show up in a running average of 12 months data. However, the level of ionising radiation from the sun begins to ramp up with sunspot activity.
- Red arrows. An El Nino warming is reliably initiated with increased flux of ionising radiation from sunspot activity, flares and eruptions in the earliest phase of the solar cycle. When a rise in geomagnetic activity occurs to reinforce the response to increased short wave radiation this can be a strong event. However, this is not assured because geomagnetic activity is only loosely tied to sunspot activity. The warming event increases evaporation from the ocean. Although relative humidity in the atmosphere always lags behind the increase in sea surface temperature there is a strong increase in specific humidity (grams of water per cubic metre of air). If eventually, a precipitation event is triggered (sunspot activity is episodic and the law of diminishing returns is never suspended), the cooling event becomes self reinforcing because cloud is rapidly produced, light is reflected and precipitation cools the land surface, moistens it, thereby insulating it against temperature gain. This cools the atmosphere. Once a cooling event is generated it tends to persist until atmospheric precipitable water is near exhaustion. (The Green Arrows show this cooling event which is due to a response of the atmosphere). In the early phase of the solar cycle the atmosphere itself can be a strong driver because of the drying due to the La Nina at solar minimum and the wetting due to the first warming event. The rise in sunspot activity to solar maximum is usually very steep. The La Nina of 2000, at the height of cycle 23 was generated entirely by the atmospheric response to abundant moisture generated by the strong El Nino of 1997-8. This La Nina of 2000 established against the trend of rising geomagnetic activity. The same strong atmospheric response drove the La Nina events of 1967, 1978 and 1979. These cooling events are sometimes associated with sunspot maximum when sunspot activity frequently can be punctuated by swift depressions and geomagnetic activity tends to stall.
- The first strong surge in geomagnetic activity in the decline phase of the sunspot cycle usually brings the atmosphere to heel and it is apparent that sea surface temperature then moves with the aa index in the decline phase of the solar cycle.
- In the absence of a governor such as a marked increase in the solar wind, a process of oscillating warming and cooling events may follow the strong cooling event that follows the first El Nino. Cooling events can be accentuated by volcanic events. The La Nina at the minimum between cycle 19 and 20 was reinforced by the eruption of the Indonesian volcano Agung in 1963. Geomagnetic activity in the first half of cycle 20 was weak and if anything tended to reinforce the downswing in sea surface temperature in mid cycle. Ever more violent swings in temperature occurred. A cooling pattern was established. However, in 1973 a strong pulse in the solar wind brought the atmosphere to heel and from that point warming and cooling proceeded in step with change in the intensity of the solar wind. The decline phase in the sunspot cycle weakens short wave radiation and enables geomagnetic activity to play this strong role.
- As noted above there is a good relationship between geomagnetic activity and sea surface temperature in the decline phase of the solar cycle. In the last part of cycle 18 and the entirety of cycle 19 sea surface temperatures ran with geomagnetic activity. This pattern began in 1948 and lasted until 1965. Perhaps this was assisted by the atmospheric response to the very strong warming event late in cycle 18 and the very strong rise in geomagnetic activity at the start of cycle 19.
If more than one factor influences sea surface temperature and the influence of each factor waxes and wanes over time, reliance upon statistical correlation is inappropriate. Even when the correlation is excellent, causation is not implied. There is no substitute for observation and deduction in problem solving.
If the behaviour of the atmosphere is dependent upon orbital considerations geomagnetic indices that properly relate to hemispherical effects might produce stronger relationships with sea surface temperature than seen here.
The relationship between the solar wind and sea surface temperature is deterministic in the decline phase of the solar cycle and conditional in the rising phase. Even in the decline phase of the cycle there is sometimes a reprise in sunspot activity.
The change in seas surface temperature wrought by the joint interaction between the atmosphere and the sun is called ENSO. ENSO is climate change in action. The cause of climate change must be sought in long term change in the atmosphere, in particular the humidity of the atmosphere, because it influences cloud cover. It is change in the sun that drives the change in humidity.
ENSO and long term climate change
Figure 19 shows the course of change in temperature at 10hPa at the poles and the equator. It is plain that the upper stratosphere exhibits cycles of cooling and warming that are longer in duration than the eleven year solar cycle, reflecting change in the factors affecting the strength of the polar vortex in both hemispheres. A marked lift in the temperature of the stratosphere occurred over Antarctica in 1974-8. This points to long term cycles driven by changes in the sun. A cooling Antarctic stratosphere after 1978 represents diminished ozone content as the vortex strengthens. The strengthening vortex should relate to a weakening solar wind, increasing atmospheric density and declining muon counts. 10hPa represents about the limit of impact of short term change in ocean temperature on the temperature of the stratosphere. In the 1970s the ocean cooled strongly. The response in the stratosphere should have been warming. In fact it cooled, revealing that other more important factors are at work at the 10hPa level. The marked increase in sea surface temperature after 1978 occurred as temperatures in the stratosphere peaked strongly, again testifying to the solar influence driving ozone content.
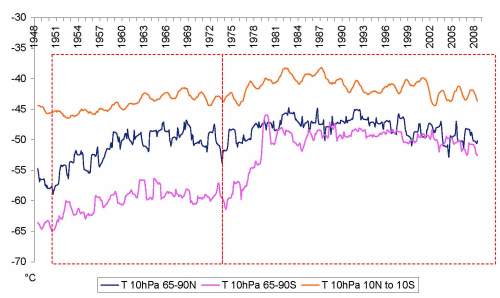
Figure 19
Figure 19 by the author. Twelve month moving average of monthly data centered on the seventh month. Data: http://www.cdc.noaa.gov/cgi-bin/data/timeseries/timeseries1.pl
Figure 20 shows the relationship between the aa index and 200hPa temperature at 20-30°S latitude. It is apparent that the southern hemisphere suffered a step change in temperature in the upper troposphere at the same time as the temperature in the polar stratosphere jumped. The rise in 200hPa temperature associated with the first El Nino of each solar cycle is marked. As noted in the discussion in connection with figure 17, this warming is associated with sunspot rather than geomagnetic activity.
A pole-ward shift of the subtropical high pressure cells and a simultaneous lift in 200hPa temperature at all latitudes occurred in 1978 . This is reflected in a marked increase in 200hPa temperature at 20-30°S latitude. Since that time both 200hPa temperature and the aa index have gradually declined.
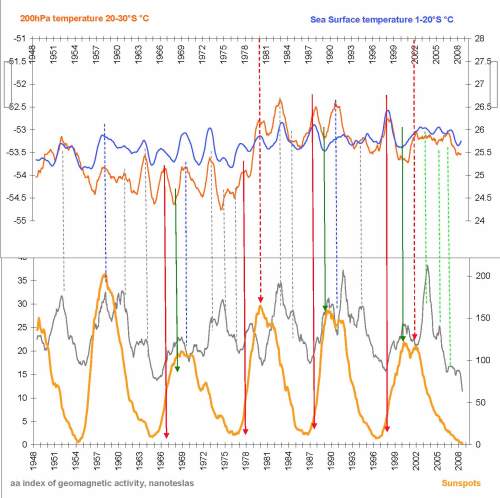
- Figure 20
Figure 20 by the author. Twelve month moving average of monthly data centered on the seventh month. Data: http://www.cdc.noaa.gov/cgi-bin/data/timeseries/timeseries1.pl
In relation to figure 20 it is observed that:
The solar wind as represented by the aa index of geomagnetic activity is not synchronised with sunspot activity.
200hPa temperature at 20-30°S varies independently of surface temperature but is well synchronised with the onset of sunspot activity and geomagnetic activity after solar maximum.
Red arrows: El Nino induced by rise in sunspot activity
Red arrows discontinuous: El Nino induced by sunspot activity at a time of weak geomagnetic activity.
Grey discontinuous line: El Nino induced by geomagnetic activity.
Blue discontinuous line: El Nino induced by a combination of sunspot maximum and a peak in geomagnetic activity.
Green discontinuous line: El Nino related to geomagnetic activity that is related to cloud loss due to heating of the northern hemisphere in boreal summer rather than change in upper troposphere temperature in the southern hemisphere.
Green Arrow: La Nina induced by atmospheric moisture saturation and the onset of a precipitation event that occurs following a strong El Nino regardless of sunspot or geomagnetic activity. Frequently appears close to solar maximum.
Change in the subtropical high pressure cells related to the strength of the trade winds and sea surface warming
It is the change in the strength of the trade winds across the Pacific that has long been associated with the ENSO phenomenon. When the temperature rises at the top of a high pressure cell the surface atmospheric pressure falls and the differetial between high pressure cells in the east and low pressure cells in the west is reduced. The trades weaken. The ice cloud that inhabits the top of the troposphere over the major centres of convection evaporates with the increase in temperature. The ocean warms. The volume of air circulating in the Hadley cell increases, the subtropical high pressure cells move toward the poles as do the jets and the relatively cloud free area of the trade wind zone expands to the north and south. That accelerates the rate of warming of the tropical sea and dries the Mediterranean climates on the west coast of the continents by extending the length of the summer season. The increase in sea surface temperature in the tropics drives water vapour into the tropical stratosphere reducing its ozone content. Near surface relative humidity declines and with it cloud cover in general. That is the situation from which the Earth is now emerging. As sunspot and geomagnetic activity further declines on the weak solar cycles that are expected through to 2030 the tropical oceans and the globe will cool.
The increase in the temperature in the stratosphere and upper troposphere in 1978 pushed the atmosphere into an El Nino straightjacket between 1978 and 2003. Is it any wonder that the ocean warmed, and with it the layers of the atmosphere that are in close contact with the sea. Above this layer, there has been no warming at all. This is the observational fact that confounds greenhouse theory. The suggestion that trace gases drive atmospheric temperature is patently wrong in the light of this observation. Religious fantasies are not a good base upon which to formulate public policy.
Will the tropical warming event of January, February 2009 blow up into a full El Nino event? I think not. The upper stratosphere over the pole has cooled strongly. The marked positive anomalies that appeared at 20-30°S seem to be fading as the Arctic cools. The next opportunity for warming will be associated with temperature variability in the Antarctic from mid year. It is then that ultraviolet light will shine on the high pressure cells of the northern hemisphere. Until we see more evidence of solar activity from sunspot cycle 24, the Earth will likely cool. As I write it is raining in February in South West Australia and we have the winter woollies out. We are looking forward to the third wet winter in a row.
The atmosphere has been dried out by La Nina orientation of three years in the last four. It has been an extended solar minimum and stratospheric ozone levels are high. Spring will come suddenly to the northern hemisphere and summer will be warm. The annual loss of cloud in the global atmosphere that is due to the warming of the northern land masses will be more extensive than normal and the oceans will again warm strongly. If short wave radiation increases, as it seems to be doing, if the polar vortex is weakened by the solar wind and ozone content of the upper troposphere continues to increase then perhaps we will see warming.
References
1Werner, A., Volk, C. M., Ivanova, E. V., Wetter, T., Schiller, C., Schlager, H., and Konopka, P.: Quantifying transport into the Arctic lowermost stratosphere, Atmos. Chem. Phys. Discuss., 9, 1407-1446, 2009.
Very interesting essay. Maybe I missed it but what function do you give ozone, an absorber of solar energy or an efficient emitter of IR to space?
I am sure this paper will stir up the global warming/cooling communities.
By: Boris Winterhalter on March 9, 2009
at 2:10 pm
Hi Boris,
Thanks for the feedback.
You ask: what function do you give ozone?
From the climate change viewpoint ozone in the upper troposphere is a potent influence via its mediation of temperature in the ice cloud zone. There is little moisture in the zone but it gives great value per gram weight because of the multi branching crystalline structure. This ice is highly reflective in the visible spectrum. Upper atmosphere moisture levels depends upon convection in the tropics and uplift in the frontal zones.
Ozone absorbs not only in the UV spectrum but also at the wave length of Earth emission so it produces a strong seasonal peak in the stratosphere in July. However, there is no evidence that ozone in the stratosphere functions as a greenhouse gas because there is no effective transfer downwards into the troposphere. Convective forces are too strong. That mid year maximum in the stratosphere between 150hPa and 30hPa that appears all the way from the north pole to about 30°S latitude is not present at 200hPa.
At what level do we get efficient emission of IR to Space. Decompressive cooling due to convection takes care of most of the heat load in the tropical atmosphere. This yields the lowest temperature in the entire atmosphere at about 15K elevation over the equator. It is the relatively cloud free zone between 10°S and 30°S that shows a peak in IR emission. Here the tropical ocean is well mixed with flows from Antarctica and is cool. Paradoxically, the coolest parts of this zone over the very cold waters west of South America show up as a hot spot in the Stratosphere. This is due to absorption of outgoing IR by ozone.
I see no problems in relation to IR emission…no greenhouse effect at all. The troposphere above 700hPa heats with El Nino events and returns to the original temperature with the next La Nina. Below 700hPa we have water vapour as refrigerant.
The ocean is the heat store and it varies in temperature with irradiance that directly depends upon cloud cover.
By: erlhapp on March 9, 2009
at 5:59 pm
Thanks for this! It will taake a while to read!
By: Mike Davis on March 9, 2009
at 3:02 pm
“This is nonsense. If sufficient energy were to be trapped in the troposphere to actually cause the stratosphere to cool, the oceans would soon begin to boil.”
This is incorrect. It doesn’t work by actually trapping energy. See:
http://www.atmosphere.mpg.de/enid/20c.html
By: fred on March 9, 2009
at 3:43 pm
Thanks Fred. Mine is a considered comment.
The ozone content of the stratosphere depends upon multiple influences. It is created and sustained by short wave energy from the sun and in the highest levels of the stratosphere above 10hPa the temperature probably reflects that influence most strongly. Hence you will see strong variation there over the period of record. The temperature decline at 10hPa and above is recent.
In the tropics ozone levels depend upon ocean temperature. Even up to 10hP there is an inverse correlation with ocean temperature. Closer to the pole ozone depends upon the strength of the vortex with its erosive nitrogen coming down from the mesosphere. The volume of the circulation is related to the twin influences of short wave radiation ionizing the atmosphere and the solar wind shifting the energized material, and with it, the neutrals. The concentration of these erosive materials in vortex air is related to solar activity.
At a given ozone concentration in a particular place in the stratosphere the temperature primarily depends upon incoming and outgoing radiation. there is a peak in mid year and a trough when the sun is closest to the Earth. That shows the relative effect of incoming and outgoing radiation. The globe emits more IR mid year because of the heating of the northern land masses and 3% cloud loss at that time (globally).
The stratosphere is a big place with diverse trends. To suggest that it is cooling because of energy retention in the troposphere is a very broad generalization and a heroic one at that.
Above 700hPa there is no evidence of energy retention in the troposphere. There is just a series of stronger warming events between 1978 and 2003 with periods where the temperature is at the same level as it was when the record began. You can derive a trend out of that if you so desire. But it’s not a trend in my book.
By: erlhapp on March 9, 2009
at 6:25 pm
Erl:
Would it be possible to have a condensed version of this to place on other sites with a link back to this site for the full article. I am a member on a couple of other sites where I have liked to your site.
I watched your exchange on CA and thought you brought a fresh approch to the issue.
That is why I came to this site to see what else you have to offer.
By: Mike Davis on March 11, 2009
at 9:43 am
That should have been “linked” rather than liked
By: Mike Davis on March 11, 2009
at 9:52 am
Thanks for the suggestion Mike. It’s up there.
By: erlhapp on March 11, 2009
at 7:58 pm
Utterly fascinating so far. One detail. You say “Figure 16 shows that the temperature in Antarctic varies much less than in the Arctic.” but I see temp in Antarctic varying c. 60 deg, ie MORE than temp in Arctic varying c. 30 deg.
By: Lucy Skywalker on March 11, 2009
at 7:36 pm
Thanks Lucy.
I am not referring to the annual fluctuation. Sorry about the possible confusion. Compare the grey lines in figures 15 and 16. They show the amplitude of the inter-annual fluctuation in the past. The big inter-annual fluctuation in the temperature in the Arctic is related to the stop go nature of the vortex. The Arctic is a lot warmer. The vortex exists only in winter and even then its notoriously variable. Hence the Arctic Oscillation Index.
By: erlhapp on March 11, 2009
at 8:07 pm
A very interesting paper. In your opinion have these factors in climate change been sufficiently taken into consideration in the IPCC reports, or are we too early in the investigation process to adequately determine the impact.
By: George on January 23, 2010
at 3:47 pm
Hi George, The dynamics by which the polar vortexes influence the ozone content of the upper atmosphere is well known but the implications are as yet unexplored. The identity between upper troposphere temperature and sea surface temperature remains unrecognized in mainstream climate science. The dynamics are complex because we have two poles and the vortexes are most unequal in their activity. The sea surface temperature in the summer hemisphere is much affected by vortex dynamics in the winter hemisphere. That demands some mental gymnastics. The conceptual difficulties are confounded by an amplified variation in stratospheric temperature within 10 degrees of latitude of the equator that is called the QBO. There seems to be a notion that it is change in the wind direction and atmospheric waves that drive the temperature change in the equatorial stratosphere rather than the other way round.
It is well recognized that the Arctic Oscillation affects mid latitude temperatures in the northern hemisphere as has been amply demonstrated over the last several months. But the phenomena, causes and implications of long term exchange of atmospheric pressure between the poles and mid latitudes represent a yawning chasm in the understanding of broad scale climate phenomena in mainstream climate science.
Mainstream climate science recognizes a link between sea surface temperature at the equator and sudden warmings of the polar stratosphere but assumes that the latter drives the former whereas it is actually the other way around.
Too much emphasis is given to the notion of ‘atmospheric waves’ in contravention to the laws of physics.
Lastly, if you start out with the notion that greenhouse dynamics determines the temperature of the atmosphere rather than the atmosphere behaving as a dissipative medium its a bit like assuming that the Earth is flat rather than spherical. It leads to all sorts of conceptual difficulties.
So, the answer is no.
By: erlhapp on January 31, 2010
at 11:25 am